Black & Decker 2011 Annual Report Download - page 9
Download and view the complete annual report
Please find page 9 of the 2011 Black & Decker annual report below. You can navigate through the pages in the report by either clicking on the pages listed below, or by using the keyword search tool below to find specific information within the annual report.-
 1
1 -
 2
2 -
 3
3 -
 4
4 -
 5
5 -
 6
6 -
 7
7 -
 8
8 -
 9
9 -
 10
10 -
 11
11 -
 12
12 -
 13
13 -
 14
14 -
 15
15 -
 16
16 -
 17
17 -
 18
18 -
 19
19 -
 20
20 -
21
-
22
-
23
-
24
-
25
-
26
-
27
-
28
-
29
-
30
-
31
-
32
-
33
-
34
-
35
-
36
-
37
-
38
-
39
-
40
-
41
-
42
-
43
-
44
-
45
-
46
-
47
-
48
-
49
-
50
-
51
-
52
-
53
-
54
-
55
-
56
-
57
-
58
-
59
-
60
-
61
-
62
-
63
-
64
-
65
-
66
-
67
-
68
-
69
-
70
-
71
-
72
-
73
-
74
-
75
-
76
-
77
-
78
-
79
-
80
-
81
-
82
-
83
-
84
-
85
-
86
-
87
-
88
-
89
-
90
-
91
-
92
-
93
-
94
-
95
-
96
-
97
-
98
-
99
-
100
-
101
-
102
-
103
-
104
-
105
-
106
-
107
-
108
-
109
-
110
-
111
-
112
-
113
-
114
-
115
-
116
-
117
-
118
-
119
-
120
-
121
-
122
-
123
-
124
-
125
-
126
-
127
-
128
-
129
-
130
-
131
-
132
-
133
-
134
-
135
-
136
-
137
-
138
-
139
-
140
 |
 |

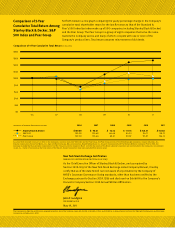
Set forth below is a line graph comparing the yearly percentage change in the Company’s
cumulative total shareholder return for the last five years to that of the Standard &
Poor’s Index (an index made up of companies including Stanley Black & Decker)
and the Peer Group. The Peer Group is a group of eight companies that serve the same
markets the Company serves and many of which compete with one or more of the
Company’s product lines. Total return assumes reinvestment of dividends.
The Company has filed the certifications required by Section of the Sarbanes-Oxley Act of as Exhibits (i)(a) and (i)(b) to its Annual Report on Form -K filed with the Securities and Exchange
Commission on February , .
Comparison of -Year
Cumulative Total Return Among
Stanley Black & Decker, S&P
Index and Peer Group
New York Stock Exchange Certification
ANNUAL CEO CERTIFICATION SECTION A.A
As the Chief Executive Ocer of Stanley Black & Decker, and as required by
Section A.(a) of the New York Stock Exchange Listed Company Manual, I hereby
certify that as of the date hereof I am not aware of any violation by the Company of
NYSE’s Corporate Governance listing standards, other than has been notified to the
Exchange pursuant to Section A.(b) and disclosed on Exhibit H to the Company’s
Domestic Company Section A Annual Written Armation.
John F. Lundgren
PRESIDENT & CEO
May ,
THE POINTS IN THE ABOVE TABLE ARE AS FOLLOWS:
Stanley Black & Decker $ . $ . $ . $ . $ . $ .
S&P . . . . . .
Peer Group . . . . . .
Assumes $ invested on January , , in the Company’s common stock, S&P Index and the Peer Group. The Peer Group consists of the following eight companies: Cooper Industries, Inc.,
Danaher Corporation, Illinois Tool Works, Inc., Ingersoll-Rand Company, Masco Corporation, Newell Rubbermaid, Inc., Snap-On Incorporated and The Sherwin-Williams Company. Prior to , the
Company included the Black & Decker Corporation in its Peer Group. Due to the merger on March , , the results of The Black & Decker Corporation are now included in the Company’s consolidated
results. As a matter of consistency, the total returns of the Black & Decker Corporation have been excluded from all prior years.
$180
Comparison of 5-Year Cumulative Total Return (IN MILLIONS)
$120
$140
$160
$100
$80
$60
$40
$20
$0
06 07 08 09 10 11