Black & Decker 2011 Annual Report Download - page 8
Download and view the complete annual report
Please find page 8 of the 2011 Black & Decker annual report below. You can navigate through the pages in the report by either clicking on the pages listed below, or by using the keyword search tool below to find specific information within the annual report.-
 1
1 -
 2
2 -
 3
3 -
 4
4 -
 5
5 -
 6
6 -
 7
7 -
 8
8 -
 9
9 -
 10
10 -
 11
11 -
 12
12 -
 13
13 -
 14
14 -
 15
15 -
 16
16 -
 17
17 -
 18
18 -
 19
19 -
20
-
21
-
22
-
23
-
24
-
25
-
26
-
27
-
28
-
29
-
30
-
31
-
32
-
33
-
34
-
35
-
36
-
37
-
38
-
39
-
40
-
41
-
42
-
43
-
44
-
45
-
46
-
47
-
48
-
49
-
50
-
51
-
52
-
53
-
54
-
55
-
56
-
57
-
58
-
59
-
60
-
61
-
62
-
63
-
64
-
65
-
66
-
67
-
68
-
69
-
70
-
71
-
72
-
73
-
74
-
75
-
76
-
77
-
78
-
79
-
80
-
81
-
82
-
83
-
84
-
85
-
86
-
87
-
88
-
89
-
90
-
91
-
92
-
93
-
94
-
95
-
96
-
97
-
98
-
99
-
100
-
101
-
102
-
103
-
104
-
105
-
106
-
107
-
108
-
109
-
110
-
111
-
112
-
113
-
114
-
115
-
116
-
117
-
118
-
119
-
120
-
121
-
122
-
123
-
124
-
125
-
126
-
127
-
128
-
129
-
130
-
131
-
132
-
133
-
134
-
135
-
136
-
137
-
138
-
139
-
140
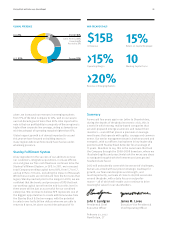
 |
 |

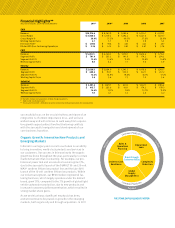
EBITDA
(Continuing Operations)(a)
$ MILLION
EPS
(Continuing Operations)(b)
Free Cash Flow(c)
$ MILLION
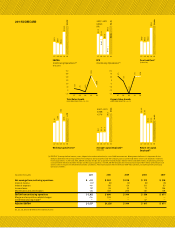
SCORECARD
MILLIONS OF DOLLARS
Net earnings from continuing operations $ $ $ $ $
Interest income
Interest expense
Income taxes
Depreciation and amortization
EBITDA from continuing operations $ , $ $ $ $
Merger and acquisition-related charges
Restructuring charge(b)
Adjusted EBITDA $ , $ , $ $ $
(b), (c), (d), (e) and (f) refer to the inside back cover.
(a) “EBITDA” (earnings before interest, taxes, depreciation and amortization) is a non-GAAP measurement. Management believes it is important for the
ability to determine the earnings power of the Company and to properly value the Company, due to current high levels of non-cash expenses related to
recent acquisitions. In and , EBITDA excludes merger and acquisition-related charges of $ million and $ million, respectively, primarily
associated with the Black & Decker merger and Niscayah acquisition. In , EBITDA excludes the restructuring charge of $ million pertaining to cost
actions taken in response to weakened economic conditions. A full reconciliation with the relevant GAAP measurement, net earnings from continuing
operations, follows:
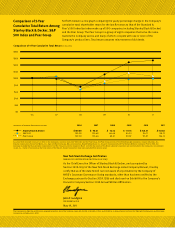
Working Capital Turns(d) Average Capital Employed(e)
$ BILLION
Return on Capital
Employed(f)
Total Sales Growth
LONGTERM OBJECTIVE: +%
Organic Sales Growth
LONGTERM OBJECTIVE: +%
07
(%)
150
120
90
60
30
0
–30
08 09 10 11
24%
12%
2%
–16%
125%
07
(%)
10
50
0
–5
–10
–15
–20
08 09 10 11
5%
5%
–2%
–20%
5%
11
$1,559
10
$1,228
09
$544
07
$671
08
$617
11
$5.24
10
$4.15$1.35
09
$2.81
07
$3.76
08
$3.33$2.67
$4.06
11
$1,004
10
$936
09
$443
07
$457
08
$422
6.7X
10
5.7X
09
7.9X
07
5.3X
08
5.9X
11 11
$10.8
10
$8.6
09
$3.4
07
$3.1
08
$3.4
11
10.8%
10
9.5%
09
9.4%
07
14.4%
08
13.4%
CAGR:
%
CAGR:
+%