Best Buy 2001 Annual Report Download - page 4
Download and view the complete annual report
Please find page 4 of the 2001 Best Buy annual report below. You can navigate through the pages in the report by either clicking on the pages listed below, or by using the keyword search tool below to find specific information within the annual report.-
 1
1 -
 2
2 -
 3
3 -
 4
4 -
 5
5 -
 6
6 -
 7
7 -
 8
8 -
 9
9 -
 10
10 -
 11
11 -
 12
12 -
 13
13 -
 14
14 -
 15
15 -
16
-
17
-
18
-
19
-
20
-
21
-
22
-
23
-
24
-
25
-
26
-
27
-
28
-
29
-
30
-
31
-
32
-
33
-
34
-
35
-
36
-
37
-
38
-
39
-
40
-
41
-
42
-
43
-
44
-
45
-
46
-
47
-
48
-
49
-
50
-
51
-
52
-
53
-
54
-
55
-
56
 |
 |

Best Buy Co., Inc.
3
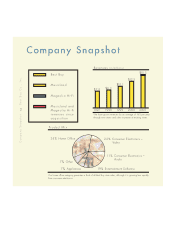
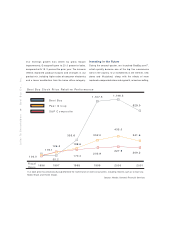
Company Snapshot
Inventory management remains a strength of the company.
Our gross profit percentage improvement reflects changes in
our product mix, both among and within our categories.
Our employee base has grown17% annually to support our
growth initiatives.
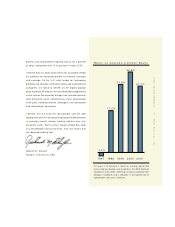
We finished the year with a strong cash position despite
paying for our two acquisitions with cash.
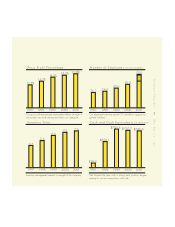
Gross Profit Percentage
13.5%
15.7%
18.0% 19.2%
1997 1998 1999 2000 2001
20.0%
Number of Employees (in thousands)
36.3 39.0 45.0
55.0
1997 1998 1999 2000 2001
75.0
Inventory Turns
1997 1999 2001
1998 2000
Cash and Cash Equivalents (in millions)
1997 1998 1999 2000 2001
4.6
6.6
7.6
5.6
7.2 $785.8
$520.1
$89.8
$750.7 $746.9