Berkshire Hathaway 2014 Annual Report Download - page 88
Download and view the complete annual report
Please find page 88 of the 2014 Berkshire Hathaway annual report below. You can navigate through the pages in the report by either clicking on the pages listed below, or by using the keyword search tool below to find specific information within the annual report.-
 1
1 -
2
-
3
-
4
-
5
-
6
-
7
-
8
-
9
-
10
-
11
-
12
-
13
-
14
-
15
-
16
-
17
-
18
-
19
-
20
-
21
-
22
-
23
-
24
-
25
-
26
-
27
-
28
-
29
-
30
-
31
-
32
-
33
-
34
-
35
-
36
-
37
-
38
-
39
-
40
-
41
-
42
-
43
-
44
-
45
-
46
-
47
-
48
-
49
-
50
-
51
-
52
-
53
-
54
-
55
-
56
-
57
-
58
-
59
-
60
-
61
-
62
-
63
-
64
-
65
-
66
-
67
-
68
-
69
-
70
-
71
-
72
-
73
-
74
-
75
-
76
-
77
-
 78
78 -
 79
79 -
 80
80 -
 81
81 -
 82
82 -
 83
83 -
 84
84 -
 85
85 -
 86
86 -
 87
87 -
 88
88 -
 89
89 -
 90
90 -
 91
91 -
 92
92 -
 93
93 -
 94
94 -
 95
95 -
 96
96 -
 97
97 -
 98
98 -
99
-
100
-
101
-
102
-
103
-
104
-
105
-
106
-
107
-
108
-
109
-
110
-
111
-
112
-
113
-
114
-
115
-
116
-
117
-
118
-
119
-
120
-
121
-
122
-
123
-
124
-
125
-
126
-
127
-
128
-
129
-
130
-
131
-
132
-
133
-
134
-
135
-
136
-
137
-
138
-
139
-
140
-
141
-
142
-
143
-
144
-
145
-
146
-
147
-
148
 |
 |

BERKSHIRE HATHAWAY INC.
and Subsidiaries
Management’s Discussion and Analysis of
Financial Condition and Results of Operations
Results of Operations
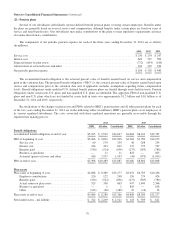
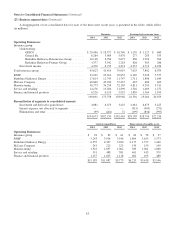
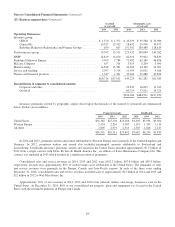
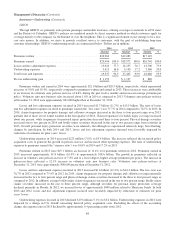
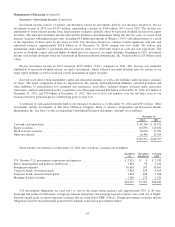
Net earnings attributable to Berkshire Hathaway shareholders for each of the past three years are disaggregated in the table
that follows. Amounts are after deducting income taxes and exclude earnings attributable to noncontrolling interests. Amounts
are in millions.
2014 2013 2012
Insurance – underwriting ......................................................... $ 1,692 $ 1,995 $ 1,046
Insurance – investment income .................................................... 3,542 3,708 3,397
Railroad ...................................................................... 3,869 3,793 3,372
Utilities and energy ............................................................. 1,882 1,470 1,323
Manufacturing, service and retailing ................................................ 4,468 3,877 3,357
Finance and financial products ..................................................... 1,243 1,008 899
Investment and derivative gains/losses .............................................. 3,321 4,337 2,227
Other ......................................................................... (145) (712) (797)
Net earnings attributable to Berkshire Hathaway shareholders ........................ $19,872 $19,476 $14,824
Through our subsidiaries, we engage in a number of diverse business activities. Our operating businesses are managed on
an unusually decentralized basis. There are essentially no centralized or integrated business functions (such as sales, marketing,
purchasing, legal or human resources) and there is minimal involvement by our corporate headquarters in the day-to-day
business activities of the operating businesses. Our senior corporate management team participates in and is ultimately
responsible for significant capital allocation decisions, investment activities and the selection of the Chief Executive to head
each of the operating businesses. It also is responsible for establishing and monitoring Berkshire’s corporate governance
practices, including, but not limited to, communicating the appropriate “tone at the top” messages to its employees and
associates, monitoring governance efforts, including those at the operating businesses, and participating in the resolution of
governance-related issues as needed. The business segment data (Note 23 to the accompanying Consolidated Financial
Statements) should be read in conjunction with this discussion.
Our insurance businesses generated after-tax earnings from underwriting in each of the last three years, including $1.7
billion in 2014. Periodic earnings from insurance underwriting are significantly impacted by the magnitude of catastrophe loss
events occurring during the period. In 2014, we did not incur any losses from significant catastrophe events, compared to after-
tax losses of approximately $285 million in 2013 and $725 million in 2012.
Our railroad business earnings increased 2.0% in 2014, although earnings were negatively impacted by various service-
related challenges during the year. Earnings from our railroad business in 2013 exceeded 2012 by 12.5% driven by increased
volume over the network. Earnings of our utilities and energy businesses in 2014 exceeded 2013 by 28.0%, due to the
acquisition of NV Energy in December 2013 and higher earnings from several of our other energy businesses. Earnings from
utility and energy businesses in 2013 exceeded 2012 by 11.1%. Earnings from our manufacturing, service and retailing
businesses in 2014 increased 15.2% over 2013, which increased 15.5% over 2012. These increases reflected the impact of bolt-
on business acquisitions, earnings growth in certain operations and reductions in earnings attributable to noncontrolling
interests. “Other” in the preceding table includes after-tax earnings from our investments in Heinz Holdings of $652 million in
2014 and $95 million in 2013.
After-tax investment and derivative gains were approximately $3.3 billion in 2014, $4.3 billion in 2013 and $2.2 billion in
2012. In each year, after-tax gains included gains from the reductions in estimated liabilities under equity index put option
contracts and dispositions of investments, partially offset by other-than-temporary impairment charges. In 2014, after-tax gains
included approximately $2.0 billion related to the exchanges of Phillips 66 (in the first quarter) and Graham Holdings Company
(in the second quarter) common stocks for a specified subsidiary of each of those companies. After-tax investment gains in 2013
included gains associated with the fair value increases of certain investment securities where unrealized gains or losses were
reflected in periodic earnings. In 2012, after-tax investment and derivative gains also included gains from settlements and
expirations of credit default contracts. We believe that investment and derivatives gains/losses are often meaningless in terms of
understanding our reported results or evaluating our economic performance. These gains and losses have caused and will likely
continue to cause significant volatility in our periodic earnings.
86