Berkshire Hathaway 2014 Annual Report Download - page 101
Download and view the complete annual report
Please find page 101 of the 2014 Berkshire Hathaway annual report below. You can navigate through the pages in the report by either clicking on the pages listed below, or by using the keyword search tool below to find specific information within the annual report.-
 1
1 -
2
-
3
-
4
-
5
-
6
-
7
-
8
-
9
-
10
-
11
-
12
-
13
-
14
-
15
-
16
-
17
-
18
-
19
-
20
-
21
-
22
-
23
-
24
-
25
-
26
-
27
-
28
-
29
-
30
-
31
-
32
-
33
-
34
-
35
-
36
-
37
-
38
-
39
-
40
-
41
-
42
-
43
-
44
-
45
-
46
-
47
-
48
-
49
-
50
-
51
-
52
-
53
-
54
-
55
-
56
-
57
-
58
-
59
-
60
-
61
-
62
-
63
-
64
-
65
-
66
-
67
-
68
-
69
-
70
-
71
-
72
-
73
-
74
-
75
-
76
-
77
-
78
-
79
-
80
-
81
-
82
-
83
-
84
-
85
-
86
-
87
-
88
-
89
-
90
-
 91
91 -
 92
92 -
 93
93 -
 94
94 -
 95
95 -
 96
96 -
 97
97 -
 98
98 -
 99
99 -
 100
100 -
 101
101 -
 102
102 -
 103
103 -
 104
104 -
 105
105 -
 106
106 -
 107
107 -
 108
108 -
 109
109 -
 110
110 -
 111
111 -
112
-
113
-
114
-
115
-
116
-
117
-
118
-
119
-
120
-
121
-
122
-
123
-
124
-
125
-
126
-
127
-
128
-
129
-
130
-
131
-
132
-
133
-
134
-
135
-
136
-
137
-
138
-
139
-
140
-
141
-
142
-
143
-
144
-
145
-
146
-
147
-
148
 |
 |
Management’s Discussion (Continued)
Manufacturing, Service and Retailing (Continued)
Manufacturing (Continued)
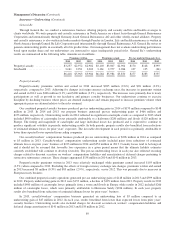
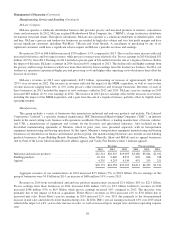
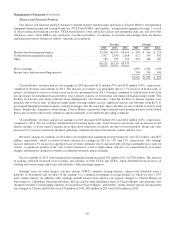
Marmon’s manufacturing revenues were $5.95 billion in 2014, an increase of $791 million (15%) compared to 2013. The
revenue increase in 2014 was primarily attributable to the beverage dispensing and merchandising businesses acquired at the
beginning of 2014. Excluding this acquisition’s impact, revenues were relatively unchanged from 2013. In 2014, Marmon
experienced volume-driven revenue growth in several business markets, including: commercial trailer and aftermarket brake
drums; residential water treatment systems in China and the United States; specialty metal pipe, tubing and steel beam; specialty
and utility cable products; and automotive, safety and construction fastener markets. These increases were substantially offset
by revenue declines from lower copper prices and lower volumes in the electrical and plumbing products businesses and the
strategic decision to exit the low margin building wire and copper tubing businesses. Marmon’s manufacturing pre-tax earnings
were $708 million in 2014, an increase of $111 million (19%) over earnings in 2013. The earnings increase primarily reflected
the favorable impact of the acquisition of IMI plc beverage dispensing and merchandising businesses, the impact of the revenue
growth discussed previously and cost savings associated with restructuring actions taken in the retail store equipment and
electrical and plumbing products businesses.
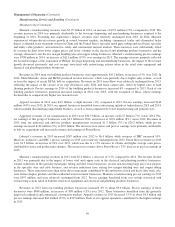
Revenues in 2014 from our building products businesses were approximately $10.1 billion, an increase of 5% over 2013. In
2014, Johns Manville, Acme and MiTek produced revenue increases, which were primarily due to higher sales volume, as well
as from the impact of recent MiTek bolt-on acquisitions. Revenues in 2014 from Shaw were relatively unchanged from 2013,
reflecting the impact of the closure of its rugs division in early 2014 and lower carpet sales, offset by higher sales of hard
flooring products. Pre-tax earnings in 2014 of the building products businesses increased 6% compared to 2013. Each of our
building products businesses generated increased earnings in 2014 over 2013, with the exception of Shaw, whose earnings
declined due to comparatively higher raw material costs.
Apparel revenues in 2014 were $4.3 billion, a slight increase (1%) compared to 2013. Pre-tax earnings increased $140
million (44%) over 2013. In 2014, our apparel businesses benefitted from restructuring initiatives undertaken in 2013 and 2014,
which included discontinuing unprofitable business, as well as from comparatively lower manufacturing and pension costs.
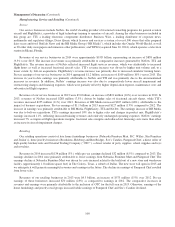
Aggregate revenues of our manufacturers in 2013 were $34.3 billion, an increase of $2.15 billion (7%) versus 2012. Pre-
tax earnings of this group of businesses were $4.2 billion in 2013, an increase of $294 million (8%) versus 2012. Revenues in
2013 from our industrial and end-user products manufacturers increased $1.3 billion (7%) to $20.3 billion, while pre-tax
earnings increased $132 million (5%) to $3.0 billion. The increases in revenues and pre-tax earnings were primarily attributable
to bolt-on acquisitions and increased revenues and earnings of Forest River.
Lubrizol’s revenues in 2013 increased $267 million over 2012 to $6.4 billion, while revenues of IMC increased 10%.
However, Lubrizol’s and IMC’s pre-tax earnings in 2013 were relatively unchanged from 2012. Forest River revenues in 2013
were $3.3 billion, an increase of 24% over 2012, which was due to a 17% increase in volume and higher average sales prices,
attributable to price and product mix changes. The increase in revenues drove Forest River’s 32% increase in pre-tax earnings in
2013.
Marmon’s manufacturing revenues in 2013 were $5.2 billion, a decrease of 3.5% compared to 2012. The revenue decline
in 2013 was primarily due to the impact of lower steel and copper costs in the electrical and plumbing products businesses,
volume reductions in the specialty metal pipe, tubing and steel beam businesses, several non-recurring large prior year projects
in the specialty wire and cable business, and revenue reductions from exiting low margin building wire and copper tubing
businesses. These reductions more than offset the revenue gains contributed by the automotive clutch and heavy duty truck axle,
store fixture display products and the residential water treatment businesses. Marmon’s manufacturing pre-tax earnings in 2013
were $597 million, and were relatively unchanged from 2012. Pre-tax earnings benefitted from cost savings associated with
restructuring actions taken in both the retail store equipment and electrical and plumbing products businesses.
Revenues in 2013 from our building products businesses increased 8% to about $9.6 billion. Pre-tax earnings of these
businesses were $846 million, an increase of $98 million (13%) over 2012. These businesses benefitted from the generally
improved residential and commercial construction markets. Apparel revenues in 2013 increased 3.5% to about $4.3 billion and
pre-tax earnings increased $64 million (25%) to $315 million. Each of our apparel operations contributed to the higher earnings
in 2013.
99