Berkshire Hathaway 1999 Annual Report Download - page 53
Download and view the complete annual report
Please find page 53 of the 1999 Berkshire Hathaway annual report below. You can navigate through the pages in the report by either clicking on the pages listed below, or by using the keyword search tool below to find specific information within the annual report.-
 1
1 -
2
-
3
-
4
-
5
-
6
-
7
-
8
-
9
-
10
-
11
-
12
-
13
-
14
-
15
-
16
-
17
-
18
-
19
-
20
-
21
-
22
-
23
-
24
-
25
-
26
-
27
-
28
-
29
-
30
-
31
-
32
-
33
-
34
-
35
-
36
-
37
-
38
-
39
-
40
-
41
-
42
-
 43
43 -
 44
44 -
 45
45 -
 46
46 -
 47
47 -
 48
48 -
 49
49 -
 50
50 -
 51
51 -
 52
52 -
 53
53 -
 54
54 -
 55
55 -
 56
56 -
 57
57 -
 58
58 -
 59
59 -
 60
60 -
 61
61 -
 62
62 -
 63
63 -
64
-
65
-
66
-
67
-
68
-
69
-
70
-
71
-
72
-
73
-
74
 |
 |

52
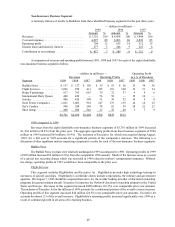
Management's Discussion (Continued)
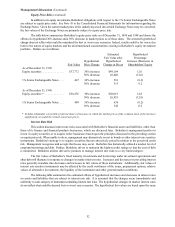
Equity Price Risk (continued)
In addition to its equity investments, Berkshire's obligations with respect to the 1% Senior Exchangeable Notes
are subject to equity price risks. See Note 10 to the Consolidated Financial Statements for information regarding the
Exchange Notes. Given the current market price of the underlying stock into which Exchange Notes may be converted,
the fair values of the Exchange Notes are primarily subject to equity price risk.
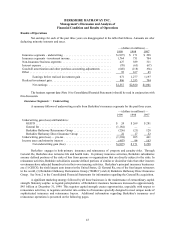
The table below summarizes Berkshire's equity price risks as of December 31, 1999 and 1998 and shows the
effects of a hypothetical 30% increase and a 30% decrease in market prices as of those dates. The selected hypothetical
change does not reflect what could be considered the best or worst case scenarios. Indeed, results could be far worse due
both to the nature of equity markets and the aforementioned concentrations existing in Berkshire's equity investment
portfolio. Dollars are in millions.
Estimated Hypothetical
Fair Value after Percentage
Hypothetical Hypothetical Increase (Decrease) in
Fair Value Price Change Change in Prices Shareholders’ Equity
As of December 31, 1999
Equity securities .............. $37,772 30% increase $49,104 12.6
30% decrease 26,440 (12.6)
1% Senior Exchangeable Notes ... 447 30% increase 581 (0.2)
30% decrease 313 0.2
As of December 31, 1998
Equity securities * ............. $38,476 30% increase $50,019 12.8
30% decrease 26,933 (12.8)
1% Senior Exchangeable Notes ... 489 30% increase 636 (0.2)
30% decrease 342 0.2
* Includes redeemable convertible preferred shares of investees in which the market prices of the common stock of the investees
significantly exceeded the related conversion prices.
Interest Rate Risk
This section discusses interest rate risks associated with Berkshire’s financial assets and liabilities, other than
those of its finance and financial products businesses, which are discussed later. Berkshire's management prefers to
invest in equity securities or to acquire entire businesses based upon the principles discussed in the preceding section
on equity price risk. When unable to do so, management may alternatively invest in bonds or other interest rate sensitive
instruments. Berkshire's strategy is to acquire securities that are attractively priced in relation to the perceived credit
risk. Management recognizes and accepts that losses may occur. Berkshire has historically utilized a modest level of
corporate borrowings and debt. Further, Berkshire strives to maintain the highest credit ratings so that the cost of debt
is minimized. Berkshire utilizes derivative products to manage interest rate risks to a very limited degree.
The fair values of Berkshire's fixed maturity investments and borrowings under investment agreements and
other debt will fluctuate in response to changes in market interest rates. Increases and decreases in prevailing interest
rates generally translate into decreases and increases in fair values of those instruments. Additionally, fair values of
interest rate sensitive instruments may be affected by the credit worthiness of the issuer, prepayment options, relative
values of alternative investments, the liquidity of the instrument and other general market conditions.
The following table summarizes the estimated effects of hypothetical increases and decreases in interest rates
on assets and liabilities that are subject to interest rate risk. It is assumed that the changes occur immediately and
uniformly to each category of instrument containing interest rate risks. The hypothetical changes in market interest rates
do not reflect what could be deemed best or worst case scenarios. The hypothetical fair values are based upon the same