Berkshire Hathaway 1998 Annual Report Download - page 11
Download and view the complete annual report
Please find page 11 of the 1998 Berkshire Hathaway annual report below. You can navigate through the pages in the report by either clicking on the pages listed below, or by using the keyword search tool below to find specific information within the annual report.-
 1
1 -
 2
2 -
 3
3 -
 4
4 -
 5
5 -
 6
6 -
 7
7 -
 8
8 -
 9
9 -
 10
10 -
 11
11 -
 12
12 -
 13
13 -
 14
14 -
 15
15 -
 16
16 -
 17
17 -
 18
18 -
 19
19 -
 20
20 -
 21
21 -
 22
22 -
23
-
24
-
25
-
26
-
27
-
28
-
29
-
30
-
31
-
32
-
33
-
34
-
35
-
36
-
37
-
38
-
39
-
40
-
41
-
42
-
43
-
44
-
45
-
46
-
47
-
48
-
49
-
50
-
51
-
52
-
53
-
54
-
55
-
56
-
57
-
58
-
59
-
60
-
61
-
62
-
63
-
64
-
65
-
66
-
67
-
68
-
69
-
70
-
71
-
72
-
73
-
74
 |
 |

10
The Economics of Property-Casualty Insurance
With the acquisition of General Re — and with GEICO’s business mush rooming — it becomes more important than ever
that you understand how to evaluate an insurance company. The key determinants are: (1) the amount of float that the
business generates; (2) its cost; and (3) most important of all, the long-term outlook for both of these factors.
To begin with, float is money we hold but don't own. In an insurance operation, float arises because premiums are
received before losses are paid, an interval that sometimes extends over many years. During that time, the insurer invests
the money. Typically, this pleasant activity carries with it a downside: The premiums that an insurer takes in usually
do not cover the losses and expenses it eventually must pay. That leaves it running an "underwriting loss," which is the
cost of float. An insurance business has value if its cost of float over time is less than the cost the company would
otherwise incur to obtain funds. But the business is a lemon if its cost of float is higher than market rates for money.
A caution is appropriate here: Because loss costs must be estimated, insurers have enormous latitude in figuring
their underwriting results, and that makes it very difficult for investors to calculate a company's true cost of float. Errors
of estimation, usually innocent but sometimes not, can be huge. The consequences of these miscalculations flow directly
into earnings. An experienced observer can usually detect large-scale errors in reserving, but the general public can
typically do no more than accept what's presented, and at times I have been amazed by the numbers that big-name
auditors have implicitly blessed. As for Berkshire, Charlie and I attempt to be conservative in presenting its underwriting
results to you, because we have found that virtually all surprises in insurance are unpleasant ones.
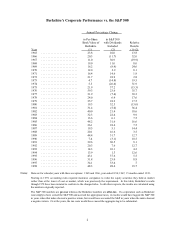
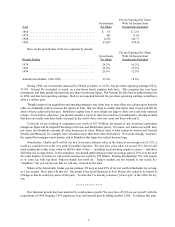
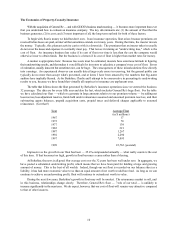
The table that follows shows the float generated by Berkshire’s insurance operations since we entered the business
32 years ago. The data are for every fifth year and also the last, which includes General Re’s huge float. For the table
we have calculated our float — which we generate in large amounts relative to our premium volume — by adding net
loss reserves, loss adjustment reserves, funds held under reinsurance assumed and unearned premium reserves, and then
subtracting agents balances, prepaid acquisition costs, prepaid taxes and deferred charges applicable to assumed
reinsurance. (Got that?)
Year Average Float
(in $ millions)
1967 17
1972 70
1977 139
1982 221
1987 1,267
1992 2,290
1997 7,093
1998 22,762 (yearend)
Impressive as the growth in our float has been — 25.4% compounded annually — what really counts is the cost
of this item. If that becomes too high, growth in float becomes a curse rather than a blessing.
At Berkshire, the news is all good: Our average cost over the 32 years has been well under zero. In aggregate, we
have posted a substantial underwriting profit, which means that we have been paid for holding a large and growing
amount of money. This is the best of all worlds. Indeed, though our net float is recorded on our balance sheet as a
liability, it has had more economic value to us than an equal amount of net worth would have had. As long as we can
continue to achieve an underwriting profit, float will continue to outrank net worth in value.
During the next few years, Berkshire’s growth in float may well be modest. The reinsurance market is soft, and
in this business, relationships change slowly. Therefore, General Re’s float — /3rds of our total — is unlikely to
2
increase significantly in the near term. We do expect, however, that our cost of float will remain very attractive compared
to that of other insurers.