Baskin Robbins 2011 Annual Report Download - page 16
Download and view the complete annual report
Please find page 16 of the 2011 Baskin Robbins annual report below. You can navigate through the pages in the report by either clicking on the pages listed below, or by using the keyword search tool below to find specific information within the annual report.-
 1
1 -
2
-
3
-
4
-
5
-
 6
6 -
 7
7 -
 8
8 -
 9
9 -
 10
10 -
 11
11 -
 12
12 -
 13
13 -
 14
14 -
 15
15 -
 16
16 -
 17
17 -
 18
18 -
 19
19 -
 20
20 -
 21
21 -
 22
22 -
 23
23 -
 24
24 -
 25
25 -
 26
26 -
27
-
28
-
29
-
30
-
31
-
32
-
33
-
34
-
35
-
36
-
37
-
38
-
39
-
40
-
41
-
42
-
43
-
44
-
45
-
46
-
47
-
48
-
49
-
50
-
51
-
52
-
53
-
54
-
55
-
56
-
57
-
58
-
59
-
60
-
61
-
62
-
63
-
64
-
65
-
66
-
67
-
68
-
69
-
70
-
71
-
72
-
73
-
74
-
75
-
76
-
77
-
78
-
79
-
80
-
81
-
82
-
83
-
84
-
85
-
86
-
87
-
88
-
89
-
90
-
91
-
92
-
93
-
94
-
95
-
96
-
97
-
98
-
99
-
100
-
101
-
102
-
103
-
104
-
105
-
106
-
107
-
108
-
109
-
110
-
111
-
112
-
113
-
114
-
115
-
116
-
117
-
118
-
119
-
120
-
121
-
122
-
123
-
124
-
125
-
126
-
127
 |
 |

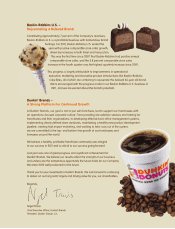
Increase comparable store sales growth of Baskin-Robbins U.S.
In the U.S., Baskin-Robbins’ core strengths are its national brand recognition, 65 years of heritage and its #1
position in the QSR industry for servings of hard serve ice cream. While the Baskin-Robbins U.S. segment has
experienced decreasing comparable store sales in three of the last four years, due primarily to increased
competition and decreased consumer spending, and the number of Baskin-Robbins U.S. stores has decreased
since 2008, we believe that we can capitalize on the brand’s strengths and generate renewed excitement for the
brand, through several initiatives including our recently introduced “More Flavors, More FunTM” marketing
campaign. In addition, at the restaurant level, we seek to improve sales by focusing on operational and service
improvements, by increasing cake and beverage sales, and through product innovation, marketing and
technology.
Bill Mitchell leads our Baskin-Robbins U.S. operations, serving as our Senior Vice President and Brand Officer
of Baskin-Robbins U.S. Prior to joining us, he served in a variety of management roles over a ten-year period at
Papa John’s International, and before that, at Popeyes, a division of AFC Enterprises. Since joining Dunkin’
Brands in August 2010, Mr. Mitchell has led the introduction of technology improvements across the Baskin-
Robbins system, which we believe will aid our franchisees in operating their restaurants more efficiently and
profitably. Under Mr. Mitchell’s leadership, comparable store sales for Baskin-Robbins U.S. increased 0.5% in
fiscal 2011, with the fourth quarter of 2011 yielding comparable store sales growth of 5.8%. Further, over 4,400
respondents, representing approximately 90% of all respondents, to our Guest Satisfaction Survey program in
December 2011 rated their overall experience as “Satisfied” or “Extremely Satisfied.”.
Industry overview
According to Technomic Information Services (“Technomic”), the QSR segment of the U.S. restaurant industry
accounted for approximately $174 billion of the total $361 billion restaurant industry sales in the U.S. in 2010.
The U.S. restaurant industry is generally categorized into segments by price point ranges, the types of food and
beverages offered, and service available to consumers. QSR is a restaurant format characterized by counter or
drive-thru ordering and limited, or no, table service. QSRs generally seek to capitalize on consumer desires for
quality and convenient food at economical prices. Technomic reports that, in 2010, QSRs comprised nine of the
top ten chain restaurants by U.S. systemwide sales and ten of the top ten chain restaurants by number of units.
Our Dunkin’ Donuts brand competes in the QSR segment categories and subcategories that include coffee,
donuts, muffins, bagels and breakfast sandwiches. In addition, in the U.S., our Dunkin’ Donuts brand has
historically focused on the breakfast daypart, which we define to include the portion of each day from 5:00 a.m.
until 11:00 a.m. While, according to Consumer Reported Eating Trends (“CREST®”) data, the compound annual
growth rate for total QSR daypart visits in the U.S. has been flat over the five-year period ended December 2011,
the compound annual growth rate for QSR visits in the U.S. during the breakfast daypart averaged 1% over the
same five-year period. There can be no assurance that such growth rates will be sustained in the future.
For the twelve months ended December 2011, there were sales of more than 7.4 billion restaurant servings of
coffee in the U.S., 79% of which were attributable to the QSR segment according to CREST®data. Over the
years, our Dunkin’ Donuts brand has evolved into a predominantly coffee-based concept, with approximately
60% of Dunkin’ Donuts’ U.S. franchisee-reported sales for fiscal year 2011 generated from coffee and other
beverages. We believe QSRs, including Dunkin’ Donuts, are positioned to capture additional coffee market share
through an increased focus on coffee offerings.
Our Baskin-Robbins brand competes primarily in QSR segment categories and subcategories that include hard-
serve ice cream as well as those that include soft serve ice cream, frozen yogurt, shakes, malts and floats. While
both of our brands compete internationally, over 63% of Baskin-Robbins restaurants are located outside of the
U.S. and represent the majority of our total international sales and points of distribution.
-6-