Barnes and Noble 2014 Annual Report Download - page 8
Download and view the complete annual report
Please find page 8 of the 2014 Barnes and Noble annual report below. You can navigate through the pages in the report by either clicking on the pages listed below, or by using the keyword search tool below to find specific information within the annual report.-
 1
1 -
 2
2 -
 3
3 -
 4
4 -
 5
5 -
 6
6 -
 7
7 -
 8
8 -
 9
9 -
 10
10 -
 11
11 -
 12
12 -
 13
13 -
 14
14 -
 15
15 -
 16
16 -
 17
17 -
 18
18 -
 19
19 -
20
-
21
-
22
-
23
-
24
-
25
-
26
-
27
-
28
-
29
-
30
-
31
-
32
-
33
-
34
-
35
-
36
-
37
-
38
-
39
-
40
-
41
-
42
-
43
-
44
-
45
-
46
-
47
-
48
-
49
-
50
-
51
-
52
-
53
-
54
-
55
-
56
-
57
-
58
-
59
-
60
-
61
-
62
-
63
-
64
-
65
-
66
-
67
-
68
-
69
-
70
-
71
-
72
-
73
-
74
-
75
-
76
 |
 |

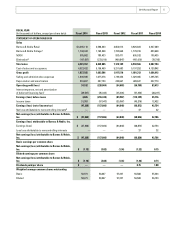
FISCAL YEAR
(In thousands of dollars, except per share data) Fiscal 2014 Fiscal 2013 Fiscal 2012 Fiscal 2011 Fiscal 2010
OTHER OPERATING DATA
Number of stores
Barnes & Noble stores 661 675 691 705 720
Barnes & Noble College 700 686 647 636 637
Total 1,361 1,361 1,338 1,341 1,357
Comparable sales increase (decrease)
Barnes & Noble Retaile(5.8)% (3.4)% 1.4% 0.7% (4.8)%
Barnes & Noble Retail Core comparable salesf(3.1)% 0.1% 0.7% (8.3)% (5.3)%
Barnes & Noble Collegeg(2.7)% (1.2)% (0.3)% (0.8)% (0.2)%
Capital expenditures $ 134,981 165,835 163,552 110,502 127,779
BALANCE SHEET DATA
Total assets $ 3,537,449 3,732,536 3,774,699 3,596,466 3,705,686
Total liabilities $ 2,300,559 2,443,631 2,730,155 2,675,969 2,706,815
Long-term debt $ — 77,000 324,200 313,100 260,400
Long-term subordinated noteh $ — 127,250 150,000 150,000 150,000
Shareholders’ Equity $ 658,696 713,743 852,271 920,497 997,321
a B&N College results are included since the Acquisition on September 30, 2009.
b Represents sales from NOOK to B&N Retail and B&N College on a sell through basis.
c Amounts for fiscal 2014, fiscal 2013, fiscal 2012, fiscal 2011 and fiscal 2010 are net of interest income of $190, $71, $0, $320, and $452, respectively.
d Noncontrolling interest represents the 50% outside interest in Begin Smart LLC. During the second quarter of fiscal 2011, the Company purchased the
remaining 50% outside interest in Begin Smart LLC.
e Comparable store sales increase (decrease) is calculated on a 52-week basis, including sales from stores that have been open for at least 15 months
and all eReader device revenue deferred in accordance with Accounting Standards Codification (ASC) 605-25 Revenue Recognition, Multiple Element
Arrangements, and does not include sales from closed or relocated stores.
f Core comparable store sales, which excludes sales of NOOK product, increase (decrease) is calculated on a 52-week basis, including sales from
stores that have been open for at least 15 months and does not include sales from closed or relocated stores.
g Comparable store sales increase (decrease) is calculated on a 52-week basis, including sales from stores that have been open for at least 15 months
and all eReader device revenue deferred in accordance with ASC 605-25 Revenue Recognition, Multiple Element Arrangements, and does not include
sales from closed or relocated stores. Additionally, for textbook rentals, comparable store sales reflects the retail selling price of a new or used
textbook when rented, rather than solely the rental fee received and amortized over the rental period.
h See Notes 5 and 19 to the Notes to Consolidated Financial Statements.
6 Barnes & Noble, Inc. SELECTED CONSOLIDATED FINANCIAL DATA continued