Barnes and Noble 2014 Annual Report Download - page 17
Download and view the complete annual report
Please find page 17 of the 2014 Barnes and Noble annual report below. You can navigate through the pages in the report by either clicking on the pages listed below, or by using the keyword search tool below to find specific information within the annual report.-
 1
1 -
2
-
3
-
4
-
5
-
6
-
 7
7 -
 8
8 -
 9
9 -
 10
10 -
 11
11 -
 12
12 -
 13
13 -
 14
14 -
 15
15 -
 16
16 -
 17
17 -
 18
18 -
 19
19 -
 20
20 -
 21
21 -
 22
22 -
 23
23 -
 24
24 -
 25
25 -
 26
26 -
 27
27 -
28
-
29
-
30
-
31
-
32
-
33
-
34
-
35
-
36
-
37
-
38
-
39
-
40
-
41
-
42
-
43
-
44
-
45
-
46
-
47
-
48
-
49
-
50
-
51
-
52
-
53
-
54
-
55
-
56
-
57
-
58
-
59
-
60
-
61
-
62
-
63
-
64
-
65
-
66
-
67
-
68
-
69
-
70
-
71
-
72
-
73
-
74
-
75
-
76
 |
 |

third-party sales of Sterling Publishing, which declined
. million, or ., versus the prior year.
• B&N College sales decreased . million, or ., to
. billion during the weeks ended May , from
. billion during the weeks ended April , ,
and accounted for . of total Company sales. The
inclusion of the rd week contributed . million in
additional sales in fiscal . The decrease was primar-
ily due to a comparable store sales decline of . on
lower textbook sales and a higher mix of lower priced
used textbook rentals, partially offset by higher general
merchandise sales. While comparable store sales per-
centages are adjusted for the impact of textbook rentals,
sales dollars are negatively impacted by the continued
growth of textbook rentals, which have a lower price than
new or used textbooks, and a portion of rental sales are
deferred over the rental period. Comparable sales dollars
decreased sales by . million for the year. Recognition
of previously deferred rental revenues increased sales by
. million for the weeks ended May , . Closed
stores decreased sales by . million, offset by new
store openings, which increased sales by . million.
• NOOK sales decreased . million, or ., to
. million during the weeks ended May ,
from . million during the weeks ended April ,
. The inclusion of the rd week contributed .
million in additional sales in fiscal . Device and
accessories sales decreased . million, or ., to
. million during the weeks ended May ,
on lower device unit volume and lower average selling
prices. Two new tablet products were launched in fiscal
versus one new e-Ink product in fiscal , as the
Company sold through most of its existing device inven-
tories at reduced prices. Digital content sales decreased
. million, or ., to . million during the
weeks ended May , . The digital content decrease
was primarily due to lower device unit volume through-
out the year, lower average selling prices and compari-
sons to the Fifty Shades and Hunger Games trilogies in the
prior year. Excluding the impact of these two trilogies,
digital content sales decreased . during the
weeks ended May , .
• The elimination represents sales from NOOK to B&N
Retail and B&N College on a sell through basis. The
decrease versus prior year was due to the lower device
sales at B&N Retail. NOOK sales, net of this elimination,
accounted for . of total Company sales.
In fiscal , the Company opened three and closed
Barnes & Noble stores, bringing its total number of B&N
Retail stores to with . million square feet. In fiscal
, the Company added B&N College stores and closed
, ending the period with B&N College stores. As of
May , , the Company operated , stores in the fifty
states and the District of Columbia.
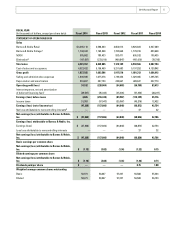
Cost of Sales and Occupancy
53 Weeks Ended 52 Weeks Ended
Dollars in thousands May 3, 2014 % Sales
April 27,
2013 % Sales
B&N Retail $2,956,821 68.8% $ 3,168,520 69.4%
B&N College 1,310,673 75.0% 1,358,172 77.0%
NOOK 423,585 83.7% 902,726 115.7%
Elimination (167,657) (33.1)% (272,919) (35.0)%
Total Cost of Sales
and Occupancy $4,523,422 70.9% $ 5,156,499 75.4%
The Company’s cost of sales and occupancy includes
costs such as merchandise costs, distribution center
costs (including payroll, freight, supplies, depreciation
and other operating expenses), rental expense, manage-
ment service agreement costs with schools, common
area maintenance and real estate taxes, partially offset by
landlord tenant allowances amortized over the life of the
lease.
Cost of sales and occupancy decreased . million, or
., to . billion in fiscal from . billion
in fiscal . Cost of sales and occupancy decreased as a
percentage of sales to . in fiscal from . in
fiscal . The decrease by segment is as follows:
• B&N Retail cost of sales and occupancy decreased as a
percentage of sales to . in fiscal from . in
fiscal . This decrease was attributable to a higher mix
of higher margin core products (which excludes NOOK®
products), increased favorable vendor allowances and
settlements, partially offset by expense deleverage
against sales decline.
• B&N College cost of sales and occupancy decreased as a
percentage of sales to . in fiscal from . in
fiscal due to a favorable sales mix of higher margin
textbook rentals and general merchandise, increased
textbook rental margin rates, and a . million favorable
LIFO adjustment this year compared to a . million
unfavorable LIFO adjustment last year. These were par-
tially offset by sales deleveraging and higher occupancy
costs as a result of contract renewals.
2014 Annual Report 15