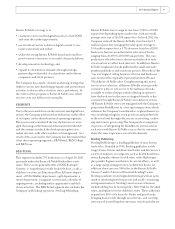
Barnes and Noble 2011 Annual Report Download - page 13
Download and view the complete annual report
Please find page 13 of the 2011 Barnes and Noble annual report below. You can navigate through the pages in the report by either clicking on the pages listed below, or by using the keyword search tool below to find specific information within the annual report.
RESULTS OF OPERATIONS
13 weeks ended
Fiscal Year Fiscal 2011 Fiscal 2010 May 2, 2009 May 3, 2008 Fiscal 2008
Sales (in thousands) $ 6,998,565 5,807,754 1,105,152 1,155,882 5,121,804
Earnings (Loss) From Continuing Operations
Attributable to Barnes & Noble, Inc.
(in thousands) $ (73,920) 36,676 (2,039) (566) 85,426
Diluted Earnings (Loss) Per Common Share
From Continuing Operations $ (1.31) 0.63 (0.04) (0.01) 1.46
Comparable Sales Increase (Decrease)
Barnes & Noble storesa 0.7% (4.8)% (5.7)% (1.5)% (5.4)%
Barnes & Noble College storesb(0.8)% (0.2)% — — —
Barnes & Noble.comc 64.7% 24.0% (7.2)% 7.2% (1.3)%
STORES OPENED
Barnes & Noble stores 1 8 6 11 35
Barnes & Noble College 15 11 — — —
B. Dalton stores — — — — —
Total 16 19 6 11 35
STORES CLOSED
Barnes & Noble stores 16 18 6 7 22
Barnes & Noble Colleged16 6———
B. Dalton stores — 47 1 2 33
Total 32 71 7 9 55
NUMBER OF STORES OPEN AT YEAR END
Barnes & Noble stores 705 720 726 717 726
Barnes & Noble Colleged636 637 — — —
B. Dalton stores — — 51 83 52
Total 1,341 1,357 777 800 778
SQUARE FEET OF SELLING SPACE AT YEAR END
(in millions)
Barnes & Noble stores 18.4 18.7 18.8 18.3 18.7
B. Dalton stores — — 0.2 0.3 0.2
Total 18.4 18.7 18.9 18.6 18.9
a Comparable store sales increase (decrease) is calculated on a 52-week basis, including sales from stores that have been open for at least 15 months
and all eReader device revenue deferred in accordance with ASC 605-25 Revenue Recognition, Multiple Element Arrangements, and does not include
sales from closed or relocated stores.
b Comparable store sales increase (decrease) is calculated on a 52-week basis, including sales from stores that have been open for at least 15 months
and all eReader device revenue deferred in accordance with ASC 605-25 Revenue Recognition, Multiple Element Arrangements, and does not include
sales from closed or relocated stores. Additionally, for textbook rentals, comparable store sales refl ects the retail selling price of a new or used
textbook when rented, rather than solely the rental fee received and amortized over the rental period.
c Comparable sales increase (decrease) is calculated on a 52-week basis and includes sales of physical and digital products made online through the
Company’s website and eBookstore, including sales through its eReader devices, and all eReader device revenue deferred in accordance with ASC
605-25 Revenue Recognition, Multiple Element Arrangements. Additionally, comparable sales refl ects the actual retail selling price for eBooks sold
under the agency model, rather than solely the commission received.
d Represents the number of B&N College stores opened and closed since the Acquisition date.
2011 Annual Report 11


