Barnes and Noble 2008 Annual Report Download - page 7
Download and view the complete annual report
Please find page 7 of the 2008 Barnes and Noble annual report below. You can navigate through the pages in the report by either clicking on the pages listed below, or by using the keyword search tool below to find specific information within the annual report.-
 1
1 -
 2
2 -
 3
3 -
 4
4 -
 5
5 -
 6
6 -
 7
7 -
 8
8 -
 9
9 -
 10
10 -
 11
11 -
 12
12 -
 13
13 -
 14
14 -
 15
15 -
 16
16 -
 17
17 -
 18
18 -
19
-
20
-
21
-
22
-
23
-
24
-
25
-
26
-
27
-
28
-
29
-
30
-
31
-
32
-
33
-
34
-
35
-
36
-
37
-
38
-
39
-
40
-
41
-
42
-
43
-
44
-
45
-
46
-
47
-
48
-
49
-
50
 |
 |

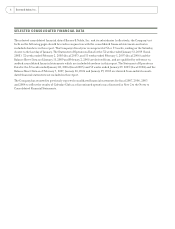
FISCAL YEAR
(In thousands, except per share data) 2008 2007 2006 2005 2004
Weighted average common shares outstanding
Basic 55,207 63,662 65,212 67,560 69,018
Diluted 57,327 67,050 69,226 72,150 75,696
OTHER OPERATING DATA
Number of stores
Barnes & Noble stores 726 713 695 681 666
B. Dalton stores 52 85 98 118 154
Total 778 798 793 799 820
Comparable store sales increase (decrease)
Barnes & Noble storesf (5.4)% 1.8% (0.3)% 2.9% 3.1%
Barnes & Noble.comg (1.3)% 13.4% (1.1)% 5.0% (1.3)%
Capital expendituresh $ 192,153 193,958 176,040 182,698 179,299
BALANCE SHEET DATA
Total assets $ 2,993,888 3,249,826 3,196,798 3,156,250 3,318,389
Long-term debt $ — — — — 245,000
a Includes primarily third-party sales of Sterling Publishing Co., Inc., a wholly-owned subsidiary of the Company.
b Amounts for fi scal 2008, 2007, 2006, 2005 and 2004 are net of interest income of $1,518, $9,169, $5,292, $6,615 and $3,133, respectively.
c One-time charge associated with the redemption of the Company’s convertible subordinated notes in fi scal 2004.
d Minority interest represents the 50% outside interest in Begin Smart LLC.
e Includes results from Calendar Club for all periods presented and GameStop, Corp.’s operations in fi scal 2004 prior to the spin-off of GameStop.
f Comparable store sales increase (decrease) is calculated on a 52-week basis, and includes sales from stores that have been open for at least 15
months and does not include closed or relocated stores.
g Comparable online sales increase (decrease) is calculated by adjusting the prior year results to conform with the fi scal 2008 presentation.
h Excludes Calendar Club capital expenditures of $1,988, $2,551, $3,333, $4,469 and $5,586 for fi scal 2008, 2007, 2006, 2005 and 2004, respectively.
6 Barnes & Noble, Inc. SELECTED CONSOLIDATED FINANCIAL DATA continued