Baker Hughes 2015 Annual Report Download - page 3
Download and view the complete annual report
Please find page 3 of the 2015 Baker Hughes annual report below. You can navigate through the pages in the report by either clicking on the pages listed below, or by using the keyword search tool below to find specific information within the annual report.-
 1
1 -
 2
2 -
 3
3 -
 4
4 -
 5
5 -
 6
6 -
 7
7 -
 8
8 -
 9
9 -
 10
10 -
 11
11 -
 12
12 -
 13
13 -
 14
14 -
15
-
16
-
17
-
18
-
19
-
20
-
21
-
22
-
23
-
24
-
25
-
26
-
27
-
28
-
29
-
30
-
31
-
32
-
33
-
34
-
35
-
36
-
37
-
38
-
39
-
40
-
41
-
42
-
43
-
44
-
45
-
46
-
47
-
48
-
49
-
50
-
51
-
52
-
53
-
54
-
55
-
56
-
57
-
58
-
59
-
60
-
61
-
62
-
63
-
64
-
65
-
66
-
67
-
68
-
69
-
70
-
71
-
72
-
73
-
74
-
75
-
76
-
77
-
78
-
79
-
80
-
81
-
82
-
83
-
84
-
85
-
86
-
87
-
88
-
89
-
90
-
91
-
92
-
93
-
94
-
95
-
96
-
97
-
98
-
99
-
100
-
101
-
102
-
103
-
104
 |
 |

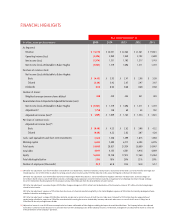
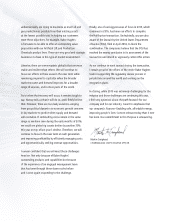
As a result of these industry dynamics,
customer activity and spending
declined significantly throughout
2015, which was reflected in the 46%
decline in the global rig count since
the fourth quarter of 2014. While
the decline in the North American
market was most severe, this has
truly been a global downturn.
The entire oilfield services industry was
negatively affected by these spending
cuts as the customer community
increasingly focused on reducing
costs and preserving cash flow. This
environment likewise had a negative
impact on our results as BakerHughes
reported a revenue decline of 36% to
$15.7 billion in 2015 compared to 2014.
On a GAAP basis, Baker Hughes
reported a net loss for 2015 of $2
billion ($4.49 per diluted share),
versus net income of $1.7billion
($3.92 per diluted share) in 2014.
Given the difficult market conditions
throughout 2015, we took significant
actions to align our business and cost
structure with the market environment,
while ensuring that the company’s
competitive position remained strong.
We also incurred merger-related
costs as we worked to close our
pending business combination with
Halliburton and plan for a successful
integration. Excluding these one-time
charges, adjusted net loss (a non-
GAAP measure) for 2015 was $209
million ($0.48 per diluted share).
Knowing that the market environment
was fluid and would remain
challenging throughout the year,
we managed the company with a
quarter-to-quarter focus, adapting to
the rapidly changing environment. In
short, we focused on controlling those
factors within our control, such as
efficiently managing our cost structure,
strengthening our cash performance
and balance sheet, improving
capital discipline, and delivering
innovative solutions and outstanding
performance to our customers.
In spite of the revenue headwinds, we
were able to contain losses by taking
actions to reduce costs companywide,
After years of growth, 2015 was an increasingly challenging
year marked by retrenchment, recalibration, transition and
transformation in the global oil and gas industry as the sector
wrestled with the impact of a supply-demand imbalance causing
oil prices to drop to seven-year lows by the end of the year.
TO OUR SHAREHOLDERS
Martin Craighead
CHAIRMAN AND CHIEF EXECUTIVE OFFICER