Baker Hughes 2015 Annual Report Download - page 2
Download and view the complete annual report
Please find page 2 of the 2015 Baker Hughes annual report below. You can navigate through the pages in the report by either clicking on the pages listed below, or by using the keyword search tool below to find specific information within the annual report.-
 1
1 -
 2
2 -
 3
3 -
 4
4 -
 5
5 -
 6
6 -
 7
7 -
 8
8 -
 9
9 -
 10
10 -
 11
11 -
 12
12 -
 13
13 -
14
-
15
-
16
-
17
-
18
-
19
-
20
-
21
-
22
-
23
-
24
-
25
-
26
-
27
-
28
-
29
-
30
-
31
-
32
-
33
-
34
-
35
-
36
-
37
-
38
-
39
-
40
-
41
-
42
-
43
-
44
-
45
-
46
-
47
-
48
-
49
-
50
-
51
-
52
-
53
-
54
-
55
-
56
-
57
-
58
-
59
-
60
-
61
-
62
-
63
-
64
-
65
-
66
-
67
-
68
-
69
-
70
-
71
-
72
-
73
-
74
-
75
-
76
-
77
-
78
-
79
-
80
-
81
-
82
-
83
-
84
-
85
-
86
-
87
-
88
-
89
-
90
-
91
-
92
-
93
-
94
-
95
-
96
-
97
-
98
-
99
-
100
-
101
-
102
-
103
-
104
 |
 |

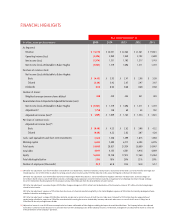
FINANCIAL HIGHLIGHTS
Year Ended December 31
(In millions, except per share amounts)
2015 2014 2013 2012 2011
As Reported:
Revenue
$ 15,742 $ 24,551 $ 22,364 $ 21,361 $ 19,831
Operating income (loss)
(2,396) 2,859 1,949 2,192 2,600
Net income (loss)
(1,974) 1,731 1,103 1,317 1,743
Net income (loss) attributable to Baker Hughes
(1,967) 1,719 1,096 1,311 1,739
Per share of common stock:
Net income (loss) attributable to Baker Hughes:
Basic
$ (4.49) $ 3.93 $ 2.47 $ 2.98 $ 3.99
Diluted
(4.49) 3.92 2.47 2.97 3.97
Dividends
0.68 0.64 0.60 0.60 0.60
Number of shares:
Weighted average common shares diluted
438 439 444 441 438
Reconciliation from As Reported to Adjusted Net Income (Loss):
Net income (loss) attributable to Baker Hughes
$ (1,967) $ 1,719 $ 1,096 $ 1,311 $ 1,739
Adjustments
(1) 1,758 130 69 43 102
Adjusted net income (loss)
(2) $ (209) $ 1,849 $ 1,165 $ 1,354 $ 1,841
Per share of common stock:
Adjusted net income (loss)
(2)
:
Basic
$ (0.48) $ 4.23 $ 2.62 $ 3.08 $ 4.22
Diluted
(0.48) 4.22 2.62 3.07 4.20
Cash, cash equivalents and short-term investments
2,324 1,740 1,399 1,015 1,050
Working capital
6,493 7,408 6,717 6,293 6,295
Total assets
24,080 28,827 27,934 26,689 24,847
Total debt
4,041 4,133 4,381 4,916 4,069
Equity
16,382 18,730 17,912 17,268 15,964
Total debt/capitalization
20% 18% 20% 22% 20%
Number of employees (thousands)
43.0 62.0 59.4 58.8 57.7
(1) 2015 after-tax adjustments: cost of $1,415 million associated with asset impairments, workforce reductions, facility closures and contract terminations; cost of $214 million for merger and
related expenses; cost of $138 million to adjust the carrying value of certain inventory; and a $9 million reduction in the accrual for litigation settlements for labor claims.
2014 after-tax adjustments: cost of $58 million related to restructuring our North Africa business; cost of $39 million for litigation settlements for labor claims; severance charges of
$21 million in North America; cost of $20 million related to a technology royalty agreement; cost of $14 million related to an impairment of a technology investment; foreign exchange
loss of $12 million from the devaluation of the Venezuelan currency; $34 million gain from the deconsolidation of a joint venture.
2013 after-tax adjustments: severance charges of $29 million; foreign exchange loss of $23 million from the devaluation of the Venezuelan currency; $17 million of restructuring charges
related to Latin America.
2012 after-tax adjustments: expenses of $15 million from the closure of a chemical manufacturing facility in the United Kingdom; expenses of $28 million for internally developed software
and other information technology assets.
2011 after-tax adjustments: a charge of $220 million related to our decision to minimize the use of the BJ Services trade name; tax benefit of $214 million from the reorganization of
certain foreign subsidiaries; expenses of $70 million associated with increasing the reserves for bad debt, inventory and certain other assets as a result of civil unrest in Libya; loss of
$26 million for the early extinguishment of debt.
(2) Adjusted net income is a non-GAAP measure comprised of net income attributable to Baker Hughes excluding the impact of certain identified items. The Company believes that adjusted
net income is useful to investors because it is a consistent measure of the underlying results of the Company’s business. Furthermore, management uses adjusted net income as a measure
of the performance of the Company’s operations.