Baker Hughes 2009 Annual Report Download - page 3
Download and view the complete annual report
Please find page 3 of the 2009 Baker Hughes annual report below. You can navigate through the pages in the report by either clicking on the pages listed below, or by using the keyword search tool below to find specific information within the annual report.-
 1
1 -
 2
2 -
 3
3 -
 4
4 -
 5
5 -
 6
6 -
 7
7 -
 8
8 -
 9
9 -
 10
10 -
 11
11 -
 12
12 -
 13
13 -
 14
14 -
15
-
16
-
17
-
18
-
19
-
20
-
21
-
22
-
23
-
24
-
25
-
26
-
27
-
28
-
29
-
30
-
31
-
32
-
33
-
34
-
35
-
36
-
37
-
38
-
39
-
40
-
41
-
42
-
43
-
44
-
45
-
46
-
47
-
48
-
49
-
50
-
51
-
52
-
53
-
54
-
55
-
56
-
57
-
58
-
59
-
60
-
61
-
62
-
63
-
64
-
65
-
66
-
67
-
68
-
69
-
70
-
71
-
72
-
73
-
74
-
75
-
76
-
77
-
78
-
79
-
80
-
81
-
82
-
83
-
84
-
85
-
86
-
87
-
88
-
89
-
90
-
91
-
92
-
93
-
94
-
95
-
96
-
97
-
98
-
99
-
100
-
101
-
102
-
103
-
104
-
105
-
106
-
107
-
108
-
109
-
110
-
111
-
112
-
113
-
114
-
115
-
116
-
117
-
118
-
119
-
120
-
121
-
122
-
123
-
124
-
125
-
126
-
127
-
128
-
129
-
130
-
131
-
132
-
133
-
134
-
135
-
136
-
137
-
138
-
139
-
140
-
141
-
142
-
143
-
144
-
145
-
146
-
147
-
148
-
149
-
150
-
151
-
152
 |
 |

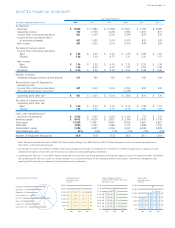
Year Ended December 31,
(In millions, except per share amounts) 2009 2008 2007 2006 2005 2004
As Reported:
Revenues $ 9,664 $ 11,864 $ 10,428 $ 9,027 $ 7,185 $ 6,080
Operating income 732 2,376 2,278 1,934 1,233 817
Income from continuing operations 421 1,635 1,514 2,399 874 526
Income before cumulative effect
of accounting change 421 1,635 1,514 2,419 879 529
Net income 421 1,635 1,514 2,419 878 529
Per share of common stock:
Income from continuing operations:
Basic $ 1.36 $ 5.32 $ 4.76 $ 7.26 $ 2.58 $ 1.57
Diluted 1.36 5.30 4.73 7.21 2.56 1.57
Net income:
Basic $ 1.36 $ 5.32 $ 4.76 $ 7.32 $ 2.59 $ 1.58
Diluted 1.36 5.30 4.73 7.27 2.57 1.58
Dividends $ 0.60 $ 0.56 $ 0.52 $ 0.52 $ 0.48 $ 0.46
Number of shares:
Weighted average common shares diluted 311 309 320 333 342 336
Reconciliation from As Reported to
operating profit:
Income from continuing operations 421 1,635 1,514 2,399 874 526
Non-operational items, net of tax(1) – – – (1,035) – –
Operating profit after tax (2) $ 421 $ 1,635 $ 1,514 $ 1,364 $ 874 $ 526
Per share of common stock:
Operating profit after tax:
Basic $ 1.36 $ 5.32 $ 4.76 $ 4.12 $ 2.58 $ 1.57
Diluted 1.36 5.30 4.73 4.10 2.56 1.57
Cash, cash equivalents and
short-term investments $ 1,595 $ 1,955 $ 1,054 $ 1,104 $ 774 $ 319
Working capital $ 4,612 $ 4,634 $ 3,837 $ 3,346 $ 2,479 $ 1,738
Total assets 11,439 11,861 9,857 8,706 7,807 6,821
Total debt 1,800 2,333 1,084 1,075 1,088 1,162
Stockholders’ equity 7,284 6,807 6,306 5,243 4,698 3,895
Total debt/equity ratio 25% 34% 17% 21% 23% 30%
Number of employees (thousands) 34.4 39.8 35.8 34.6 29.1 26.9
Note: The above excludes the results of Baker SPD, Baker Hughes Mining Tools, BIRD Machine, EIMCO Process Equipment, and our oil producing operations in
West Africa, all discontinued businesses.
(1) Includes gain on sale of our interest in affiliate, restructuring charges and reversals, and impairment of investment in affiliate and gain (loss) on disposal of assets.
Additional information of each item can be found on our website at www.bakerhughes.com/investor.
(2) Operating profit after tax is a non-GAAP measure comprised of income from continuing operations excluding the impact of certain non-operational items. We believe
that operating profit after tax is useful to investors because it is a consistent measure of the underlying results of our business. Furthermore, management uses
operating profit internally as a measure of the performance of our operations.
S E L E C T E D F I N A N C I A L H I G H L I G H T S
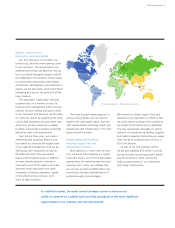
2009 REVENUES BY REGION
Canada, 5%
Asia Pacific, 11%
Middle East, 10%
Russia Caspian, 4%
USA, 32%
Africa, 11%
Europe, 15%
Latin America, 12%
$3,500
$3,000
$2,500
$2,000
$1,500
$1,000
$500
$0
TOTAL REVENUES
2007–2009, by Quarter
(In millions)
$1.60
$1.40
$1.20
$1.00
$0.80
$0.60
$0.40
$0.20
$0
TOTAL OPERATING PROFIT
AFTER TAX PER SHARE (DILUTED)
2007–2009, by Quarter
$2,400
$2,000
$1,600
$1,200
$800
$400
$0
TOTAL DEBT
2007–2009, by Quarter
(In millions)
200920082007 200920082007 200920082007
2009 Annual Report 1