BT 2009 Annual Report Download - page 4
Download and view the complete annual report
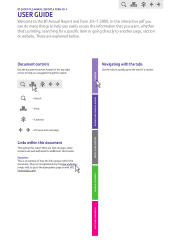
Please find page 4 of the 2009 BT annual report below. You can navigate through the pages in the report by either clicking on the pages listed below, or by using the keyword search tool below to find specific information within the annual report.-
 1
1 -
 2
2 -
 3
3 -
 4
4 -
 5
5 -
 6
6 -
 7
7 -
 8
8 -
 9
9 -
 10
10 -
 11
11 -
 12
12 -
 13
13 -
 14
14 -
 15
15 -
16
-
17
-
18
-
19
-
20
-
21
-
22
-
23
-
24
-
25
-
26
-
27
-
28
-
29
-
30
-
31
-
32
-
33
-
34
-
35
-
36
-
37
-
38
-
39
-
40
-
41
-
42
-
43
-
44
-
45
-
46
-
47
-
48
-
49
-
50
-
51
-
52
-
53
-
54
-
55
-
56
-
57
-
58
-
59
-
60
-
61
-
62
-
63
-
64
-
65
-
66
-
67
-
68
-
69
-
70
-
71
-
72
-
73
-
74
-
75
-
76
-
77
-
78
-
79
-
80
-
81
-
82
-
83
-
84
-
85
-
86
-
87
-
88
-
89
-
90
-
91
-
92
-
93
-
94
-
95
-
96
-
97
-
98
-
99
-
100
-
101
-
102
-
103
-
104
-
105
-
106
-
107
-
108
-
109
-
110
-
111
-
112
-
113
-
114
-
115
-
116
-
117
-
118
-
119
-
120
-
121
-
122
-
123
-
124
-
125
-
126
-
127
-
128
-
129
-
130
-
131
-
132
-
133
-
134
-
135
-
136
-
137
-
138
-
139
-
140
-
141
-
142
-
143
-
144
-
145
-
146
-
147
-
148
-
149
-
150
-
151
-
152
-
153
-
154
-
155
-
156
-
157
-
158
-
159
-
160
-
161
-
162
-
163
-
164
-
165
-
166
-
167
-
168
-
169
-
170
 |
 |

ADDITIONAL INFORMATION FINANCIAL STATEMENTS REPORT OF THE DIRECTORS BUSINESS AND FINANCIAL REVIEWS OVERVIEW
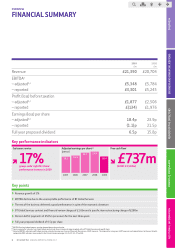
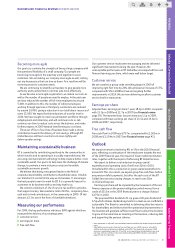
Revenue growth of 3%
EBITDA decline due to the unacceptable performance of BT Global Services
The rest of the business delivered a good performance in spite of the economic downturn
BT Global Services contract and financial review charges of £1.6bn and a specific item restructuring charge of £280m
Pension deficit payments of £525m per annum for the next three years
Full year proposed dividend of 6.5p per share
2BT GROUP PLC ANNUAL REPORT & FORM 20-F
OVERVIEW
FINANCIAL SUMMARY
aEBITDA: Earnings before interest, taxation, depreciation and amortisation.
bItems presented as ‘adjusted’ are stated before contract and financial review charges recorded within BT Global Services and specific items.
cAdjusted EBITDA, adjusted profit before taxation, adjusted earnings per share and free cash flow are non-GAAP measures. The rationale for using non-GAAP measures and reconciliations to the most directly
comparable IFRS indicators are provided in the Financial review on pages 33-35, 39, 41, 47 and 48.
2009 2008
£m £m
Revenue £21,390 £20,704
EBITDAa
– adjustedb,c£5,348 £5,784
– reported £3,301 £5,245
Profit (loss) before taxation
– adjustedb,c£1,877 £2,506
– reported £(134) £1,976
Earnings (loss) per share
– adjustedb,c18.4p 23.9p
– reported (1.1)p 21.5p
Full year proposed dividend 6.5p 15.8p
Customer service
17%
group-wide ‘right first time’
performance increase in 2009
Free cash flowc
£737m
(2008: £1,503m)
Adjusted earnings per shareb,c
(pence)
Key points
18.4
2005 2006 2007 2008 2009
18.1 19.5
22.7 23.9
Key performance indicators
ADDITIONAL INFORMATION FINANCIAL STATEMENTS REPORT OF THE DIRECTORS BUSINESS AND FINANCIAL REVIEWS OVERVIEW