Avon 2008 Annual Report Download - page 78
Download and view the complete annual report
Please find page 78 of the 2008 Avon annual report below. You can navigate through the pages in the report by either clicking on the pages listed below, or by using the keyword search tool below to find specific information within the annual report.-
 1
1 -
2
-
3
-
4
-
5
-
6
-
7
-
8
-
9
-
10
-
11
-
12
-
13
-
14
-
15
-
16
-
17
-
18
-
19
-
20
-
21
-
22
-
23
-
24
-
25
-
26
-
27
-
28
-
29
-
30
-
31
-
32
-
33
-
34
-
35
-
36
-
37
-
38
-
39
-
40
-
41
-
42
-
43
-
44
-
45
-
46
-
47
-
48
-
49
-
50
-
51
-
52
-
53
-
54
-
55
-
56
-
57
-
58
-
59
-
60
-
61
-
62
-
63
-
64
-
65
-
66
-
67
-
 68
68 -
 69
69 -
 70
70 -
 71
71 -
 72
72 -
 73
73 -
 74
74 -
 75
75 -
 76
76 -
 77
77 -
 78
78 -
 79
79 -
 80
80 -
 81
81 -
 82
82 -
 83
83 -
 84
84 -
 85
85 -
 86
86 -
 87
87 -
 88
88 -
89
-
90
-
91
-
92
 |
 |

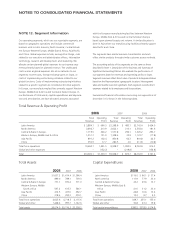
NOTES TO CONSOLIDATED FINANCIAL STATEMENTS
NOTE 12. Segment Information
Our operating segments, which are our reportable segments, are
based on geographic operations and include commercial
business units in Latin America; North America; Central & East-
ern Europe; Western Europe, Middle East & Africa; Asia Pacific;
and China. Global expenses include, among other things, costs
related to our executive and administrative offices, information
technology, research and development, and marketing. We
allocate certain planned global expenses to our business seg-
ments primarily based on planned revenue. The unallocated
costs remain as global expenses. We do not allocate to our
segments income taxes, foreign exchange gains or losses, or
costs of implementing restructuring initiatives related to our
global functions. Costs of implementing restructuring initiatives
related to a specific segment are recorded within that segment.
In Europe, our manufacturing facilities primarily support Western
Europe, Middle East & Africa and Central & Eastern Europe. In
our disclosures of total assets, capital expenditures and deprecia-
tion and amortization, we have allocated amounts associated
with the European manufacturing facilities between Western
Europe, Middle East & Africa and Central & Eastern Europe
based upon planned beauty unit volume. A similar allocation is
done in Asia where our manufacturing facilities primarily support
Asia Pacific and China.
The segments have similar business characteristics and each
offers similar products through similar customer access methods.
The accounting policies of the segments are the same as those
described in Note 1, Description of the Business and Summary of
Significant Accounting Policies. We evaluate the performance of
our segments based on revenues and operating profits or losses.
Segment revenues reflect direct sales of products to Representatives
based on the Representative’s geographic location. Intersegment
sales and transfers are not significant. Each segment records direct
expenses related to its employees and its operations.
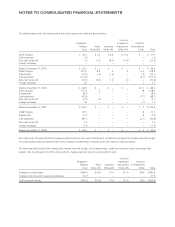
Summarized financial information concerning our segments as of
December 31 is shown in the following tables.
Total Revenue & Operating Profit
2008 2007 2006
Total
Revenue
Operating
Profit
Total
Revenue
Operating
Profit
Total
Revenue
Operating
Profit
Latin America $ 3,884.1 $ 690.3 $3,298.9 $ 483.1 $2,743.4 $ 424.0
North America 2,492.7 213.9 2,622.1 213.1 2,554.0 181.6
Central & Eastern Europe, 1,719.5 346.2 1,577.8 296.1 1,320.2 296.7
Western Europe, Middle East & Africa 1,351.7 121.0 1,308.6 33.9 1,123.7 (17.8)
Asia Pacific 891.2 102.4 850.8 64.3 810.8 42.5
China 350.9 17.7 280.5 2.0 211.8 (10.8)
Total from operations 10,690.1 1,491.5 9,938.7 1,092.5 8,763.9 916.2
Global and other expenses – (152.2) – (219.8) – (154.8)
Total $10,690.1 $1,339.3 $9,938.7 $ 872.7 $8,763.9 $ 761.4
Total Assets
2008 2007 2006
Latin America $1,657.2 $1,614.4 $1,396.4
North America 899.0 789.1 739.3
Central & Eastern Europe 771.1 970.4 771.0
Western Europe, Middle
East & Africa 567.2 615.3 546.1
Asia Pacific 412.5 437.0 392.7
China 318.6 292.3 270.1
Total from operations 4,625.6 4,718.5 4,115.6
Global and other 1,448.4 997.7 1,122.6
Total assets $6,074.0 $5,716.2 $5,238.2
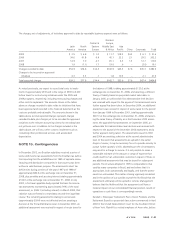
Capital Expenditures
2008 2007 2006
Latin America $116.0 $ 90.1 $ 57.4
North America 111.9 77.9 33.0
Central & Eastern Europe 42.2 29.6 13.7
Western Europe, Middle East &
Africa 41.6 31.2 33.0
Asia Pacific 24.8 16.6 13.4
China 13.2 9.7 4.5
Total from operations 349.7 255.1 155.0
Global and other 30.8 23.4 19.8
Total capital expenditures $380.5 $278.5 $174.8