Avnet 2014 Annual Report Download - page 18
Download and view the complete annual report
Please find page 18 of the 2014 Avnet annual report below. You can navigate through the pages in the report by either clicking on the pages listed below, or by using the keyword search tool below to find specific information within the annual report.
______________________
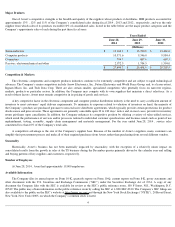
4,700 shares in May.
Item 6. Selected Financial Data
16
Period
Total Number
of Shares
Purchased
(1)
Average Price
Paid per Share
Total Number of
Shares Purchased
as Part of Publicly
Announced Plans
or Programs
Approximate Dollar
Value of Shares That
May Yet Be Purchased
Under the Plans
or Programs
April
3,800
$47.18
—
$223,223,000
May
180,774
$41.82
176,074
$215,860,000
June
—
—
—
$215,860,000
(1)
Consists of purchases of Avnet's common stock associated with the Company's ESPP as follows: 3,800 shares in April and
Years Ended
June 28,
2014 June 29,
2013 June 30,
2012 July 2,
2011 July 3,
2010
(Millions, except for per share and ratio data)
Income:
Sales
$
27,499.7
$
25,458.9
$
25,707.5
$
26,534.4
$
19,160.2
Gross profit
3,225.7
2,979.8
3,050.6
3,107.8
2,280.2
Operating income
(a)
789.9
626.0
884.2
930.0
635.6
Income tax expense
(b)
155.5
99.2
223.8
201.9
174.7
Net income
(c)
545.6
450.1
567.0
669.1
410.4
Financial Position:
Working capital
(d)
3,975.4
3,535.4
3,455.7
3,749.5
3,190.6
Total assets
11,255.5
10,474.7
10,167.9
9,905.6
7,782.4
Long-term debt
1,213.8
1,207.0
1,272.0
1,273.5
1,243.7
Shareholders’ equity
4,890.2
4,289.1
3,905.7
4,056.1
3,009.1
Per Share:
Basic earnings
3.95
3.26
3.85
4.39
2.71
Diluted earnings
3.89
3.21
3.79
4.34
2.68
Cash dividends paid
0.60
—
—
—
—
Book value per diluted share
34.90
30.64
26.12
26.28
19.66
Ratios:
Operating income as a
percentage of sales
2.9
%
2.5
%
3.4
%
3.5
%
3.3
%
Net income as a percentage of
sales
2.0
%
1.8
%
2.2
%
2.5
%
2.1
%
Return on capital
11.4
%
10.6
%
12.9
%
15.2
%
14.0
%
Quick ratio
1.2:1
1.2:1
1.2:1
1.2:1
1.4:1
Working capital
(d)
1.8:1
1.7:1
1.7:1
1.8:1
1.9:1
Total debt to capital
29.8
%
32.3
%
35.4
%
27.2
%
29.8
%
(a)
All fiscal years presented include restructuring, integration and other expenses, which totaled $94.6 million before tax, $70.8 million after
tax and $0.50 per share on a diluted basis in fiscal 2014, $149.5 million before tax, $116.4 million after tax and $0.83 per share on a diluted
basis in fiscal 2013, $73.6 million before tax, $53.0 million after tax and $0.35 per share on a diluted basis in fiscal 2012, $77.2 million
before tax, $56.2 million after tax and $0.36 per share on a diluted basis in fiscal 2011 and $25.4 million before tax, $18.8 million after tax
and $0.12 per share on a diluted basis in fiscal 2010.
(b)
Certain fiscal years presented included the impact of tax benefits primarily due to the release of valuation allowances net of additional
reserves including $43.8 million and $0.31 per share on a diluted basis in fiscal 2014, $50.4 million and $0.36


