Avnet 2011 Annual Report Download - page 18
Download and view the complete annual report
Please find page 18 of the 2011 Avnet annual report below. You can navigate through the pages in the report by either clicking on the pages listed below, or by using the keyword search tool below to find specific information within the annual report.
Table of Contents
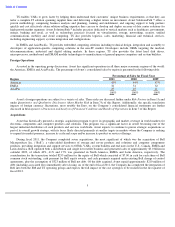
Issuer Purchases of Equity Securities
The following table presents the Company’s monthly purchases of common stock during the fourth quarter of fiscal 2011:
The purchases of Avnet common stock noted above were made on the open market to obtain shares for purchase under the
Company’s Employee Stock Purchase Plan.
In August 2011, the Board of Directors approved the repurchase of up to an aggregate of $500 million of shares of the
Company’
s common stock through a share repurchase program. The Company plans to repurchase stock from time to time at the
discretion of management in open market or privately negotiated transactions or otherwise, subject to applicable laws, regulations and
approvals, strategic considerations, market conditions and other factors. The Company may terminate or limit the stock repurchase
program at any time without prior notice.
15
Maximum Number (or
Total Number of
Approximate Dollar
Total
Shares Purchased as
Value) of Shares That
Number of
Part of Publicly
may yet be Purchased
Shares
Average Price
Announced Plans or
Under the Plans or
Period
Purchased
Paid per Share
Programs
Programs
April
4,100
$
34.80
—
—
May
6,700
$
37.07
—
—
June
4,300
$
31.74
—
—
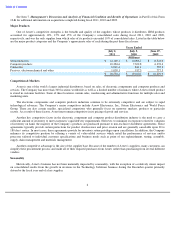
Item 6.
Selected Financial Data
Years Ended
July 2,
July 3,
June 27,
June 28,
June 30,
2011
2010
2009 (a)
2008 (a)
2007 (a)
(Millions, except for per share and ratio data)
Income:
Sales
$
26,534.4
$
19,160.2
$
16,229.9
$
17,952.7
$
15,681.1
Gross profit
3,107.8
2,280.2
2,023.0
2,313.7
2,048.6
Operating income (loss)
930.0
(b)
635.6
(c)
(1,019.0
)(d)
710.8
(e)
678.7
(f)
Income tax provision
201.9
(b)
174.7
(c)
34.7
(d)
203.8
(e)
187.9
(f)
Net income (loss)
669.1
(b)
410.4
(c)
(1,129.7
)(d)
489.6
(e)
384.4
(f)
Financial Position:
Working capital(g)
3,749.5
3,190.6
2,688.4
3,191.3
2,711.2
Total assets
9,905.6
7,782.4
6,273.5
8,195.2
7,343.7
Long
-
term debt
1,273.5
1,243.7
946.6
1,169.3
1,127.9
Shareholders
’
equity
4,056.1
3,009.1
2,760.9
4,141.9
3,417.4
Per Share:
Basic earnings (loss)
4.39
(b)
2.71
(c)
(7.49
)(d)
3.26
(e)
2.60
(f)
Diluted earnings (loss)
4.34
(b)
2.68
(c)
(7.49
)(d)
3.21
(e)
2.57
(f)
Book value per diluted share
26.28
19.66
18.30
27.17
22.84
Ratios:
Operating income (loss) margin on
sales
3.5
%(b)
3.3
%(c)
(6.3)
%(d)
4.0
%(e)
4.3
%(f)
Net income (loss) margin on sales
2.5
%(b)
2.1
%(c)
(7.0)
%(d)
2.7
%(e)
2.5
%(f)
Return on capital
15.2
%(b)
14.0
%(c)
(26.6)
%(d)
11.0
%(e)
11.2
%(f)
Quick
1.2:1
1.4:1
1.5:1
1.4:1
1.3:1
Working capital
1.8:1
1.9:1
2.1:1
2.1:1
2.0:1
Total debt to capital
27.2
%
29.8
%
26.0
%
22.7
%
25.7
%


