AutoZone 2003 Annual Report Download - page 3
Download and view the complete annual report
Please find page 3 of the 2003 AutoZone annual report below. You can navigate through the pages in the report by either clicking on the pages listed below, or by using the keyword search tool below to find specific information within the annual report.-
 1
1 -
 2
2 -
 3
3 -
 4
4 -
 5
5 -
 6
6 -
 7
7 -
 8
8 -
 9
9 -
 10
10 -
 11
11 -
 12
12 -
 13
13 -
 14
14 -
15
-
16
-
17
-
18
-
19
-
20
-
21
-
22
-
23
-
24
-
25
-
26
-
27
-
28
-
29
-
30
-
31
-
32
-
33
-
34
-
35
-
36
-
37
-
38
-
39
-
40
-
41
-
42
-
43
-
44
-
45
-
46
-
47
-
48
-
49
-
50
-
51
-
52
-
53
-
54
-
55
 |
 |

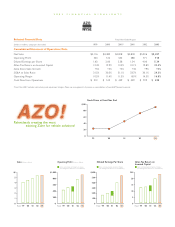
2003 FINANCIAL HIGHLIGHTS
Selected Financial Data Fiscal Year Ended August
(Dollars in millions, except per share data) 1999 2000 2001* 2001 2002 2003
Consolidated Statement of Operations Data
Net Sales $4,116 $4,483 $4,818 $4,818 $5,326 $5,457
Operating Profit 433 512 545 388 771 918
Diluted Earnings per Share 1.63 2.00 2.38 1.54 4.00 5.34
After-Tax Return on Invested Capital 12.4% 12.9% 13.4% 10.1% 19.8% 23.4%
Same Store Sales Growth +5% +5% +4% +4% +9% +3%
SG&A to Sales Ratio 31.5% 30.5% 31.1% 33.7% 30.1% 29.3%
Operating Margin 10.5% 11.4% 11.3% 8.0% 14.5% 16.8%
Cash Flow from Operations $ 312 $ 513 $ 459 $ 459 $ 739 $ 698
*Fiscal Year 2001 excludes restructuring and impairment charges. Please see management’s discussion on reconciliations of non-GAAP financial measures.
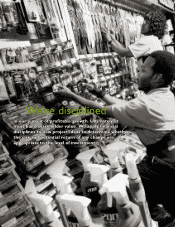
Relentlessly creating the most
exciting Zone for vehicle solutions!
Stock Prices at Fiscal Year End
’99
20
0
’00 ’01 ’02 ’03
40
60
80
$100
Sales (Dollars in Billions)
Fiscal: ’99
0
’00 ’01 ’02 ’03
$6
5
4
3
2
1
Operating Profit (Dollars in Millions)
Fiscal: ’99
0
’00 ’01 ’02 ’03
$1,000
800
600
400
200
Before restructuring and impairment charges
(See management discussion on reconciliations)
Diluted Earnings Per Share
Fiscal: ’99
0
’00 ’01 ’02 ’03
$6.00
5.00
4.00
3.00
2.00
1.00
Before restructuring and impairment charges
(See management discussion on reconciliations)
Before restructuring and impairment charges
(See management discussion on reconciliations)
After-Tax Return on
Invested Capital
Fiscal: ’99
0
’00 ’01 ’02 ’03
25%
20
15
10
5