Audiovox 2000 Annual Report Download - page 16
Download and view the complete annual report
Please find page 16 of the 2000 Audiovox annual report below. You can navigate through the pages in the report by either clicking on the pages listed below, or by using the keyword search tool below to find specific information within the annual report.-
 1
1 -
2
-
3
-
4
-
5
-
 6
6 -
 7
7 -
 8
8 -
 9
9 -
 10
10 -
 11
11 -
 12
12 -
 13
13 -
 14
14 -
 15
15 -
 16
16 -
 17
17 -
 18
18 -
 19
19 -
 20
20 -
 21
21 -
 22
22 -
 23
23 -
 24
24 -
 25
25 -
 26
26 -
27
-
28
-
29
-
30
-
31
-
32
-
33
-
34
-
35
-
36
-
37
-
38
-
39
-
40
-
41
-
42
-
43
-
44
-
45
-
46
 |
 |

Net sales were $1,424,480 in fiscal 2000, an increase of $507,395, or
55.3%, from fiscal 1999. Unit sales of wireless handsets increased by
2,842,000 units in fiscal 2000, or 46.9%, to approximately 8,909,000 units
from 6,067,000 units in fiscal 1999. This increase was attributable to sales
of portable, digital products. The addition of a new supplier also provided
a variety of new digital, wireless products that contributed to the sales
increase. The average selling price of handsets increased to $150 per unit
in fiscal 2000 from $140 per unit in fiscal 1999. The number of new wire-
less subscriptions processed by Quintex increased 30.9% in fiscal 2000,
with a corresponding increase in activation commissions of approximately
$4,571 in fiscal 2000. The average commission received by Quintex per
activation decreased by approximately 9.3% in fiscal 2000 from fiscal 1999
due to changes within the commission structure with the various carriers.
Unit gross profit margins decreased to 5.7% in fiscal 2000 from 7.8% in fis-
cal 1999, reflecting an increase in average unit cost, partially offset by an
increase in selling prices. During 2000, Wireless adjusted the carrying value
of its analog inventory by recording an $8,152 cost reduction. This charge
will enable Wireless to effectively exit the active analog market. However,
even as Wireless and the wireless communications market continues to
shift away from analog to digital technology, Wireless will continue to sell
analog telephones on a limited basis to specific customers to support spe-
cific carrier programs.
Operating expenses increased to $54,524 in fiscal 2000 from $44,248 in
fiscal 1999. As a percentage of net sales, however, operating expenses
decreased to 3.8% during fiscal 2000 compared to 4.8% in fiscal 1999.
Selling expenses increased in fiscal 2000 from fiscal 1999, primarily in
commissions and divisional marketing expenses. General and administra-
tive expenses increased in fiscal 2000 from fiscal 1999, primarily in office
salaries, temporary personnel, depreciation and amortization. Warehous-
ing, assembly and repair expenses increased in fiscal 2000 from fiscal
1999, primarily in direct labor. Pre-tax income for fiscal 2000 was
$30,997, a decrease of $258 from fiscal 1999.
Management believes that the wireless industry is extremely competitive
and that this competition could affect gross margins and the carrying
value of inventories in the future as new competitors enter the market-
place. Also, timely delivery and carrier acceptance of new product could
affect our quarterly performance.
ELECTRONICS RESULTS
The following table sets forth for the fiscal years indicated certain state-
ments of income data for the Electronics Group expressed as a percent-
age of net sales:
1999 2000
Net sales:
Mobile electronics $117,500 48.5% $135,074 48.6%
Sound 82,843 34.2 77,825 28.0
Consumer electronics 38,150 15.7 60,968 21.9
Other 3,959 1.6 3,949 1.5
Total net sales 242,452 100.0 277,816 100.0
Gross profit 53,025 21.9 60,066 21.6
Total operating expenses 38,645 15.9 43,360 15.6
Operating income 14,380 5.9 16,706 6.0
Other expense (3,021) (1.2) (1,937) (0.7)
Pre-tax income $ 11,359 4.7% $ 14,769 5.3%
Net sales were $277,816 in fiscal 2000, a 14.6% increase from net sales
of $242,452 in fiscal 1999. Mobile and consumer electronics’ sales
increased over last year, partially offset by decreases in sound and other.
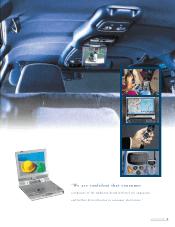
Sales of mobile video within the mobile electronics category increased
over 40% in fiscal 2000 to approximately $73.2 million from $52.0 million
in fiscal 1999. Consumer electronics increased 59.8% to $60,968 in fiscal
2000 from $38,150 in fiscal 1999. These increases were due to the intro-
duction of new product lines in both categories. These increases were
partially offset by a decrease in the sound category, particularly SPS, AV,
private label and Prestige audio lines.
Operating expenses were $43,360 in fiscal 2000, a 12.2% increase from
operating expenses of $38,645 in fiscal 1999. Selling expenses increased
during fiscal 2000, primarily in commissions, salesmen’s salaries, adver-
tising and divisional marketing. General and administrative expenses
increased from fiscal 1999, mostly in office salaries, occupancy costs,
depreciation and amortization. Warehousing and assembly expenses
increased in fiscal 2000 from fiscal 1999, primarily due to field warehous-
ing expense. Pre-tax income for fiscal 2000 was $14,769, an increase of
$3,410 from fiscal 1999.
The Company believes that the Electronics Group has an expanding mar-
ket with a certain level of volatility related to both domestic and interna-
tional new car sales and general economic conditions. Also, certain of its
products are subject to price fluctuations which could affect the carrying
value of inventories and gross margins in the future.
OTHER INCOME AND EXPENSE
Interest expense and bank charges increased $1,598 during fiscal 2000
from fiscal 1999.
Equity in income of equity investments, net, decreased by approximately
$1,685 for fiscal 2000 compared to fiscal 1999. The majority of the
decrease was due to decreases in the equity income of ASA and TALK.
The decrease in ASA was due to a decrease in sales of mobile video prod-
ucts. The decrease in TALK was due to a change from analog to GSM
within the wireless marketplace. During fiscal 2000, the Company dis-
posed of its equity investment in TALK.
MANAGEMENT’SDISCUSSION AND ANALYSIS OF
FINANCIAL CONDITION AND RESULTS OF OPERATIONS (continued)
14