Audiovox 1997 Annual Report Download - page 10
Download and view the complete annual report
Please find page 10 of the 1997 Audiovox annual report below. You can navigate through the pages in the report by either clicking on the pages listed below, or by using the keyword search tool below to find specific information within the annual report.-
 1
1 -
 2
2 -
 3
3 -
 4
4 -
 5
5 -
 6
6 -
 7
7 -
 8
8 -
 9
9 -
 10
10 -
 11
11 -
 12
12 -
 13
13 -
 14
14 -
 15
15 -
 16
16 -
 17
17 -
 18
18 -
 19
19 -
 20
20 -
 21
21 -
22
-
23
-
24
-
25
-
26
-
27
-
28
-
29
-
30
-
31
-
32
-
33
 |
 |

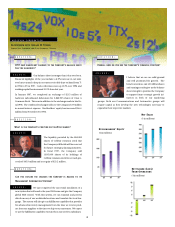
The Company markets its products under its own brand as well as
private labels to a large and diverse distribution network both domes-
tically and internationally. The Company’s products are distributed
by two separate marketing groups: Communications and
Automotive. The Communications group consists of Audiovox
Communications Corp. (ACC) and the Quintex retail operations
(Quintex), both of which are wholly-owned subsidiaries of the
Company. The Communications group markets cellular telephone
products and receives activation commissions and residual fees from
its retail sales. The price at which the Company’s retail outlets sell
cellular telephones is often affected by the activation commission the
Company will receive in connection with such sale. The activation
commission paid by a cellular telephone carrier is based upon vari-
ous service plans and promotional marketing programs offered by
the particular cellular telephone carrier. The monthly residual pay-
ment is based upon a percentage of the customer’s usage and is cal-
culated based on the amount of the cellular phone billings generated
by the base of customers activated by the Company on a particular
cellular carrier’s system. The Automotive group consists of Audiovox
Automotive Electronics (AAE) and, through February 28, 1997, Heavy
Duty Sound, which are divisions of the Company, Audiovox
Communications (Malaysia) Sdn. Bhd., Audiovox Holdings (M) Sdn.
Bhd. and Audiovox Venezuela, C.A., which are majority-owned sub-
sidiaries. Products in the Automotive group include automotive
sound and security equipment, car accessories, home and portable
sound products and mobile video. The Company allocates interest
and certain shared expenses to the marketing groups based upon
estimated usage. General expenses and other income items which
are not readily allocable are not included in the results of the various
marketing groups.
This Report on Form 10-K contains forward-looking statements
relating to such matters as anticipated financial performance and
business prospects. When used in this Report, the words “antici-
pates,” “expects,” “may,” “intend” and similar expressions are intend-
ed to be among the statements that identify forward-looking state-
ments. From time to time, the Company may also publish forward-
looking statements. The Private Securities Litigation Reform Act of
1995 provides a safe harbor for forward-looking statements. In order
to comply with the terms of the safe harbor, the Company notes that
a variety of factors, including, but not limited to, foreign currency
risks, political instability, changes in foreign laws, regulations, and
tariffs, new technologies, competition, customer and vendor relation-
ships, seasonality, inventory obsolescence and availability, could
cause the Company’s actual results and experience to differ material-
ly from the anticipated results or other expectations expressed in the
Company’s forward-looking statements.
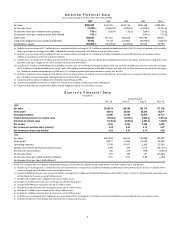
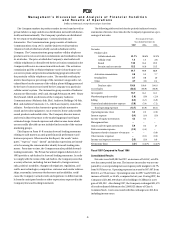
The following table sets forth for the periods indicated certain
statements of income (loss) data for the Company expressed as a per-
centage of net sales:
Percentage of Net Sales
Years Ended November 30,
1997
1996 1995
Net sales:
Product sales:
Cellular wholesale
61.1%
58.6% 52.3%
Cellular retail
1.0
1.3 2.8
Sound
14.4
16.4 20.3
Security and accessories
15.2
14.6 13.5
91.7
90.9 88.9
Activation commissions
4.9
5.5 7.7
Residual fees
0.7
0.8 1.0
Other
2.7
2.8 2.4
Total net sales
100.0
100.0 100.0
Cost of sales
(83.3)
(83.9) (85.9)
Gross profit
16.7
16.1 14.1
Warehousing and assembly
(1.9)
(1.8) (2.0)
Selling
(6.0)
(6.7) (6.9)
General and administrative expense
(5.8)
(5.4) (7.2)
Total operating expenses
(13.7)
(13.9) (16.1)
Operating income (loss)
3.0
2.2 (2.0)
Interest expense
(0.4)
(1.4) (1.9)
Income of equity investments
0.2
0.1 –
Management fees
–
– –
Gain on sale of equity investment
5.9
0.2 1.7
Debt conversion expense
(2.0)
(4.4) –
Expenses related to issuance of warrants
–
– (0.6)
Other income (expense)
–
(0.1) (0.2)
Income tax (expense) recovery
(3.5)
(1.0) 0.6
Net income (loss)
3.3%
(4.4)% (2.4)%
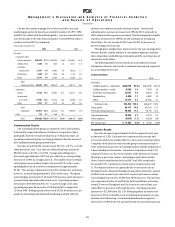
Fiscal 1997 Compared to Fiscal 1996
Consolidated Results
Net sales were $639,082 for 1997, an increase of $41,167, or 6.9%,
over the same period last year. The increase in net sales was accom-
panied by a corresponding increase in gross profit margins to 16.7%
from 16.1% last year. Operating expenses increased to $87,067 from
$83,313, a 4.5% increase. Operating income for 1997 was $19,695, an
increase of $6,620, or 50.6%, compared to last year. During 1997, the
Company sold 1,835,000 shares of its holdings of CellStar for a net
gain of $23,232. Also during 1997, the Company exchanged $21,479
of its subordinated debentures for 2,860,925 shares of Class A
Common Stock. Costs associated with this exchange were $12,844,
including income taxes.
M a n a g e m e n t ’ s D i s c u s s i o n a n d A n a l y s i s o f F i n a n c i a l C o n d i t i o n
a n d R e s u l t s o f O p e r a t i o n s
(Dollars in thousands, except share and per share data)
9