Atmos Energy 2010 Annual Report Download - page 5
Download and view the complete annual report
Please find page 5 of the 2010 Atmos Energy annual report below. You can navigate through the pages in the report by either clicking on the pages listed below, or by using the keyword search tool below to find specific information within the annual report.-
 1
1 -
 2
2 -
 3
3 -
 4
4 -
 5
5 -
 6
6 -
 7
7 -
 8
8 -
 9
9 -
 10
10 -
 11
11 -
 12
12 -
 13
13 -
 14
14 -
 15
15 -
 16
16 -
17
-
18
-
19
-
20
-
21
-
22
-
23
-
24
-
25
-
26
-
27
-
28
-
29
-
30
-
31
-
32
-
33
-
34
-
35
-
36
-
37
-
38
-
39
 |
 |

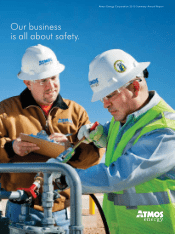
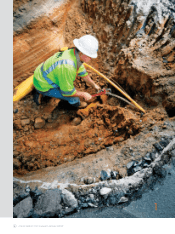
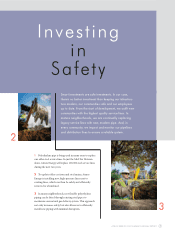
Atmos Energy places a top priority on providing safe and reliable natural gas service
to its customers in the more than 1,600 communities we serve across 12 states.
ATMOS ENERGY 2010 SUMMARY ANNUAL REPORT 3
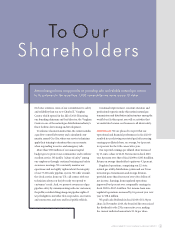
To Our
Shareholders
No better evidence exists of our commitment to safety
and reliability than our new Charles K. Vaughan
Center, which opened in the fall of 2010. Honoring
our founding chairman and lead director, the Vaughan
Center is one of the natural gas distribution industry’s
nest facilities for training and development.
To enhance classroom instruction, the center includes
a gas ow-control laboratory and a simulated com-
munity, named Gas City, where our service technicians
apply their training to situations they can encounter
when responding to service and emergency calls.
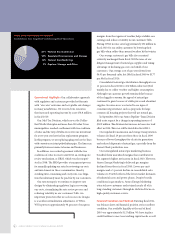
More than $300 million of our annual capital
budget goes to protect our communities and to deliver
excellent service. We instill a “culture of safety” among
our employees through continual training and safety
awareness meetings. We constantly monitor our
operations and are highly vigilant about the integrity
of our 77,000-mile pipeline system. We oer around-
the-clock service from our U.S. call centers with our
technicians always on the job ready to respond to
customers’ needs. And, we promote awareness of gas
pipeline safety by communicating with our customers,
the public, residents living along our pipeline rights of
way, reghters and other rst-responders, excavators
and contractors, and state and local public ocials.
Continual improvement, constant attention and
professional expertise make this nation’s natural gas
transmission and distribution infrastructure among the
world’s best. In this report, you will see activities that
we undertake because our business is all about safety.
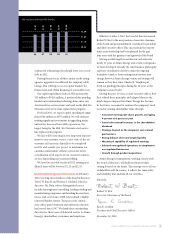
2010 Results We are pleased to report that our
operational and nancial performance in scal 2010
resulted in us achieving our stated goal of increasing
earnings per diluted share, on average, by 4 percent
to 6 percent for the 10th consecutive year.
Our reported earnings per diluted share increased
by 13 cents a share to $2.20. Net income in scal 2010
rose 8 percent over that of scal 2009 to $205.8 million.
Return on average shareholders’ equity was 9.1 percent.
Regulated operations, comprising our 12-state
natural gas utility distribution system and our Texas
intrastate gas transmission and storage division,
provided more than four out of every ve dollars of
net income. Earnings from regulated operations
improved by 6 percent over comparable earnings in
scal 2009 to $167.4 million. Net income from non-
regulated operations increased by 16 percent year over
year to $38.4 million.
We paid cash dividends in scal 2010 of $1.34 per
share. In November 2010, the board of directors raised
the dividend for the 27th consecutive year, making
the current indicated annual rate $1.36 per share.