Atmos Energy 2003 Annual Report Download - page 14
Download and view the complete annual report
Please find page 14 of the 2003 Atmos Energy annual report below. You can navigate through the pages in the report by either clicking on the pages listed below, or by using the keyword search tool below to find specific information within the annual report.-
 1
1 -
2
-
3
-
 4
4 -
 5
5 -
 6
6 -
 7
7 -
 8
8 -
 9
9 -
 10
10 -
 11
11 -
 12
12 -
 13
13 -
 14
14 -
 15
15 -
 16
16 -
 17
17 -
 18
18 -
 19
19
 |
 |

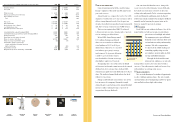
September 30 (Dollars in thousands, except share data) 2003 2002
Assets
Property, plant and equipment $ 2,463,992 $ 2,103,428
Construction in progress 16,147 24,399
2,480,139 2,127,827
Less accumulated depreciation and amortization 964,150 827,507
Net property, plant and equipment 1,515,989 1,300,320
Current assets
Cash and cash equivalents 15,683 47,991
Cash held on deposit in margin account 17,903 10,192
Accounts receivable, less allowance for doubtful accounts of $13,051 in 2003
and $10,509 in 2002 216,783 136,227
Gas stored underground 168,765 91,783
Other current assets 38,863 44,962
Total current assets 457,997 331,155
Goodwill and intangible assets 273,499 190,380
Deferred charges and other assets 271,023 159,530
$ 2,518,508 $ 1,981,385
Capitalization and Liabilities
Shareholders’ equity
Common stock, no par value (stated at $.005 per share);
100,000,000 shares authorized; issued and outstanding:
2003 – 51,475,785 shares, 2002 – 41,675,932 shares $ 257 $ 208
Additional paid-in capital 736,180 508,265
Retained earnings 122,539 106,142
Accumulated other comprehensive loss (1,459) (41,380)
Shareholders’ equity 857,517 573,235
Long-term debt 863,918 670,463
Total capitalization 1,721,435 1,243,698
Current liabilities
Accounts payable and accrued liabilities 179,852 136,773
Other current liabilities 127,923 159,727
Short-term debt 118,595 145,791
Current maturities of long-term debt 9,345 21,980
Total current liabilities 435,715 464,271
Deferred income taxes 223,350 134,540
Deferred credits and other liabilities 138,008 138,876
$ 2,518,508 $ 1,981,385
Condensed Consolidated Statements of Income
Condensed Consolidated Balance Sheets
24 25
September 30 (Dollars in thousands, except per share data) 2003 2002 2001
Operating revenues
Utility segment $ 1,554,082 $ 937,526 $ 1,380,148
Natural gas marketing segment 1,668,493 1,031,874 447,096
Other nonutility segment 21,630 24,705 59,436
Intersegment eliminations (444,289) (343,141) (161,199)
2,799,916 1,650,964 1,725,481
Purchased gas cost
Utility segment 1,062,679 559,891 1,017,363
Natural gas marketing segment 1,644,328 994,318 445,504
Other nonutility segment 1,540 8,022 48,605
Intersegment eliminations (443,607) (342,407) (161,199)
2,264,940 1,219,824 1,350,273
Gross profit 534,976 431,140 375,208
Operating expenses
Operation and maintenance 205,090 158,119 139,608
Depreciation and amortization 87,001 81,469 67,664
Taxes, other than income 55,045 36,221 37,655
Total operating expenses 347,136 275,809 244,927
Operating income 187,840 155,331 130,281
Other income (expense)
Equity in earnings of Woodward Marketing, L.L.C. ——8,062
Miscellaneous income (expense) 2,191 (1,321) (1,874)
Total other income (expense) 2,191 (1,321) 6,188
Interest charges 63,660 59,174 47,011
Income before income taxes and cumulative effect of accounting change 126,371 94,836 89,458
Income tax expense 46,910 35,180 33,368
Income before cumulative effect of accounting change 79,461 59,656 56,090
Cumulative effect of accounting change, net of income tax benefit (7,773) ——
Net income $ 71,688 $ 59,656 $ 56,090
Per share data
Basic income per share:
Income before cumulative effect of accounting change $ 1.72 $ 1.45 $ 1.47
Cumulative effect of accounting change, net of income tax benefit (.17) ——
Net income $ 1.55 $ 1.45 $ 1.47
Diluted income per share:
Income before cumulative effect of accounting change $ 1.71 $ 1.45 $ 1.47
Cumulative effect of accounting change, net of income tax benefit (.17) ——
Net income $ 1.54 $ 1.45 $ 1.47
Weighted average shares outstanding:
Basic 46,319 41,171 38,156
Diluted 46,496 41,250 38,247