Amgen 2002 Annual Report Download - page 4
Download and view the complete annual report
Please find page 4 of the 2002 Amgen annual report below. You can navigate through the pages in the report by either clicking on the pages listed below, or by using the keyword search tool below to find specific information within the annual report.-
 1
1 -
 2
2 -
 3
3 -
 4
4 -
 5
5 -
 6
6 -
 7
7 -
 8
8 -
 9
9 -
 10
10 -
 11
11 -
 12
12 -
 13
13 -
 14
14 -
 15
15 -
16
-
17
-
18
-
19
-
20
-
21
-
22
-
23
-
24
-
25
-
26
-
27
-
28
-
29
-
30
-
31
-
32
-
33
-
34
-
35
-
36
-
37
-
38
-
39
-
40
-
41
-
42
-
43
-
44
-
45
-
46
-
47
-
48
-
49
-
50
-
51
-
52
-
53
-
54
-
55
-
56
-
57
-
58
-
59
-
60
-
61
-
62
-
63
-
64
-
65
-
66
-
67
-
68
-
69
-
70
-
71
-
72
 |
 |

Page 2
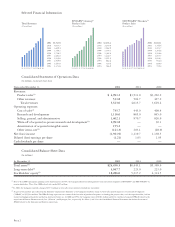
Consolidated Statement of Operations Data
(In millions, except per share data)
Years ended December 31, 2002 2001 2000
Revenues:
Product sales
(1)
$ 4,991.2 $3,511.0 $3,202.2
Other revenues 531.8 504.7 427.2
Total revenues 5,523.0 4,015.7 3,629.4
Operating expenses:
Cost of sales
(2)
735.7 443.0 408.4
Research and development 1,116.6 865.0 845.0
Selling, general, and administrative 1,462.1 970.7 826.9
Write-off of acquired in-process research and development
(3)
2,991.8 — 30.1
Amortization of acquired intangible assets 155.2 ——
Other items, net
(4)
(141.3) 203.1 (48.9)
Net (loss) income (1,391.9) 1,119.7 1,138.5
Diluted (loss) earnings per share (1.21) 1.03 1.05
Cash dividends per share — — —
Consolidated Balance Sheet Data
(In millions)
At December 31, 2002 2001 2000
Total assets
(5)
$24,456.3 $6,443.1 $5,399.6
Long-term debt
(6)
3,047.7 223.0 223.0
Stockholders’ equity
(5)
18,286.0 5,217.2 4,314.5
(1)
Due to Year 2000 contingency planning in the fourth quarter of 1999, the Company offered extended payment terms on limited shipments of EPOGEN
®
and NEUPOGEN
®
to
certain wholesalers. These Year 2000-related sales totaled $45 million.
(2)
In 2001, the Company recorded a charge of $39.5 million to write-off certain inventory deemed not recoverable.
(3)
As part of the purchase price allocation for Immunex Corporation (“Immunex”), the Company recorded a charge to write-off acquired in-process research and development
(“IPR&D”) of $2,991.8 million. The IPR&D charge represents an estimate of the fair value of purchased in-process technology for projects that, as of the acquisition date, had not
reached technological feasibility and had no alternative future use. In 2000 and 1994, the Company wrote off $30.1 million and $116.4 million of acquired IPR&D related to the
acquisition of Kinetix Pharmaceuticals, Inc. (“Kinetix”) and Synergen, Inc., respectively. See Notes 3 and 11 to the Consolidated Financial Statements for further discussion of
IPR&D related to the Immunex and Kinetix acquisitions.
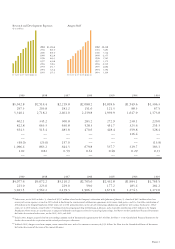
Total Revenues
($ in millions)
93 94 95 96 97 98 99 00 01 02
2002
2001
2000
1999
1998
1997
1996
1995
1994
1993
$5,523.0
4,015.7
3,629.4
3,340.1
2,718.2
2,401.0
2,239.8
1,939.9
1,647.9
1,373.8
2002
2001
2000
1999
1998
1997
1996
1995
1994
1993
93 94 95 96 97 98 99 00 01 02
2,150.0
1,962.9
1,759.1
1,382.0
1,160.7
1,071.9
882.6
720.6
586.9
$2,676.2
EPOGEN®/Aranesp®
Product Sales
($ in millions)
2002
2001
2000
1999
1998
1997
1996
1995
1994
1993
93 94 95 96 97 98 99 00 01
$1,843.1
1,346.4
1,223.7
1,256.6
1,116.6
1,055.7
1,016.3
936.0
829.0
719.4
NEUPOGEN®/Neulasta™
Product Sales
($ in millions)
02
Selected Financial Information