American Home Shield 2014 Annual Report Download - page 2
Download and view the complete annual report
Please find page 2 of the 2014 American Home Shield annual report below. You can navigate through the pages in the report by either clicking on the pages listed below, or by using the keyword search tool below to find specific information within the annual report.-
 1
1 -
 2
2 -
 3
3 -
 4
4 -
 5
5 -
 6
6 -
 7
7 -
 8
8 -
 9
9 -
 10
10 -
 11
11 -
 12
12 -
 13
13 -
14
-
15
-
16
-
17
-
18
-
19
-
20
-
21
-
22
-
23
-
24
-
25
-
26
-
27
-
28
-
29
-
30
-
31
-
32
-
33
-
34
-
35
-
36
-
37
-
38
-
39
-
40
-
41
-
42
-
43
-
44
-
45
-
46
-
47
-
48
-
49
-
50
-
51
-
52
-
53
-
54
-
55
-
56
-
57
-
58
-
59
-
60
-
61
-
62
-
63
-
64
-
65
-
66
-
67
-
68
-
69
-
70
-
71
-
72
-
73
-
74
-
75
-
76
-
77
-
78
-
79
-
80
-
81
-
82
-
83
-
84
-
85
-
86
-
87
-
88
-
89
-
90
-
91
-
92
-
93
-
94
-
95
-
96
-
97
-
98
-
99
-
100
-
101
-
102
-
103
-
104
-
105
-
106
-
107
-
108
-
109
-
110
-
111
-
112
-
113
-
114
-
115
-
116
-
117
-
118
-
119
-
120
-
121
-
122
-
123
-
124
-
125
-
126
-
127
-
128
-
129
-
130
-
131
-
132
-
133
-
134
-
135
-
136
-
137
-
138
-
139
-
140
-
141
-
142
-
143
-
144
 |
 |

1 "EKVTUFE&#*5%"NFBOTOFUJODPNFMPTTCFGPSFJODPNFMPTTGSPNEJTDPOUJOVFEPQFSBUJPOTOFUPGJODPNFUBYFTQSPWJTJPOCFOFmU
for income taxes; gain (loss) on extinguishment of debt; interest expense; depreciation and amortization expense; non-cash impairment
of software and other related costs; non-cash impairment of property and equipment; non-cash stock-based compensation expense;
restructuring charges; management and consulting fees; consulting agreement termination fees and other non-operating expenses.
For a reconciliation of Adjusted EBITDA to net income (loss), see “Item 6. Selected Financial Data” in our Annual Report on Form 10-K
included in this annual report to stockholders.
2 Adjusted EBITDA margin means Adjusted EBITDA as a percentage of revenue.
3 Adjusted Net Income means income (loss) from continuing operations before: amortization expense; impairment of software and other
related costs; consulting agreement termination fees; restructuring charges; management and consulting fees; loss on extinguishment
of debt; and the tax impact of all the aforementioned adjustments. For a reconciliation of Adjusted Net Income to income (loss) from
continuing operations, see page 12.
4 Based on Adjusted Net Income and weighted average diluted shares outstanding of 113.8 million in 2014 and 92.2 million in 2013.
5 Pre-Tax Unlevered Free Cash Flow means (i) net cash provided from operating activities from continuing operations before: cash paid
for interest expense; call premium paid on retirement of debt; premium received on issuance of debt; cash paid for income taxes, net
of refunds; cash paid for restructuring charges; cash paid for management and consulting fees; cash paid for consulting agreement
termination fees; cash paid for impairment of software and other related costs; and gain on sale of marketable securities; (ii) less
property additions. For a reconciliation of net cash provided from operating activities from continuing operations to Pre-Tax Unlevered
Free Cash Flow, see “Item 6. Selected Financial Data” in our Annual Report on Form 10-K included in this annual report to stockholders.
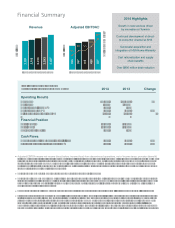
2,031
2,105
2,214
2,293
2,457
354
397
413
450
557
17%
19% 19%
20%
23%
Revenue Adjusted EBITDA¹Growth in new services driven
by innovation at Terminix
Continued development of direct-
to-consumer channel at AHS
Successful acquisition and
integration of HSA Home Warranty
Cost rationalization and supply
FKDLQEHQHÀWV
Over $800 million debt reduction
2014 Highlights
$ Millions
$ Millions
Adj. EBITDA Margin2
2010 2011 2012 2013 2014 2010 2011 2012 2013 2014
2014 2013 Change
Operating Results
Revenue $2,457 $2,293 7%
Net Loss (57) (507)
Adjusted Net Income3 167 82
Adjusted EBITDA1 557 450 24%
Diluted earnings per share4 1.47 0.89
Financial Position
Total Assets 5,134 5,905
Total Debt 3,056 3,906
Shareholder Equity 359 23
Cash Flows
Cash provided from operating activities 253 208 22%
Pre-Tax Unlevered Free Cash Flow5 525 428 23%
(In millions, except per-share data)
As of and for the years ending December 31,