America Online 2014 Annual Report Download - page 63
Download and view the complete annual report
Please find page 63 of the 2014 America Online annual report below. You can navigate through the pages in the report by either clicking on the pages listed below, or by using the keyword search tool below to find specific information within the annual report.-
 1
1 -
2
-
3
-
4
-
5
-
6
-
7
-
8
-
9
-
10
-
11
-
12
-
13
-
14
-
15
-
16
-
17
-
18
-
19
-
20
-
21
-
22
-
23
-
24
-
25
-
26
-
27
-
28
-
29
-
30
-
31
-
32
-
33
-
34
-
35
-
36
-
37
-
38
-
39
-
40
-
41
-
42
-
43
-
44
-
45
-
46
-
47
-
48
-
49
-
50
-
51
-
52
-
 53
53 -
 54
54 -
 55
55 -
 56
56 -
 57
57 -
 58
58 -
 59
59 -
 60
60 -
 61
61 -
 62
62 -
 63
63 -
 64
64 -
 65
65 -
 66
66 -
 67
67 -
 68
68 -
 69
69 -
 70
70 -
 71
71 -
 72
72 -
 73
73 -
74
-
75
-
76
-
77
-
78
-
79
-
80
-
81
-
82
-
83
-
84
-
85
-
86
-
87
-
88
-
89
-
90
-
91
-
92
-
93
-
94
-
95
-
96
-
97
-
98
-
99
-
100
-
101
-
102
-
103
-
104
-
105
-
106
-
107
-
108
-
109
-
110
-
111
-
112
-
113
-
114
-
115
-
116
-
117
-
118
-
119
-
120
-
121
-
122
-
123
-
124
-
125
-
126
-
127
-
128
-
129
-
130
-
131
-
132
-
133
-
134
-
135
-
136
-
137
-
138
-
139
-
140
-
141
-
142
-
143
-
144
-
145
-
146
-
147
-
148
-
149
-
150
-
151
-
152
-
153
-
154
-
155
-
156
 |
 |

AOL INC.
PART II—ITEM 7. MANAGEMENT’S DISCUSSION AND ANALYSIS OF FINANCIAL CONDITION
AND RESULTS OF OPERATIONS
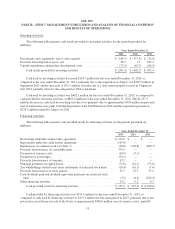
Income Tax Provision
For the year ended December 31, 2014, we recorded income before income taxes of $196.0 million and
related income tax expense of $73.2 million, which resulted in an effective tax rate of 37.3%, as compared to the
effective tax rate of 50.7% for the year ended December 31, 2013. The effective tax rate for the year ended
December 31, 2014 differed from the statutory U.S. federal income tax rate of 35.0% primarily due to the
favorable tax impact of a reduction in non-deductible permanent expenses, increases in research and
development tax credits and state income tax credits, partially offset by the tax impact of foreign losses that did
not produce a tax benefit. See “Note 6” for further information on the research and development tax credits. The
effective tax rate for the year ended December 31, 2014 decreased compared to the effective tax rate for the
period ended December 31, 2013 due to these items and the tax impact of the 2013 non-deductible goodwill
impairment charge.
For the year ended December 31, 2013, we recorded income before income taxes of $183.7 million and
related income tax expense of $93.1 million, which resulted in an effective tax rate of 50.7%, as compared to the
effective tax rate of 13.4% for the year ended December 31, 2012. The effective tax rate for the year ended
December 31, 2013 differed from the statutory U.S. federal income tax rate of 35.0% primarily due to the non-
deductible goodwill impairment charge and foreign losses that did not produce a tax benefit, offset by the benefit
of research and development tax credits. The effective tax rate for the year ended December 31, 2013 increased
compared to the effective tax rate for the period ended December 31, 2012 primarily due to the tax impact of the
2012 patent transaction with Microsoft which resulted in an effective tax rate lower than the statutory U.S.
federal income tax rate.
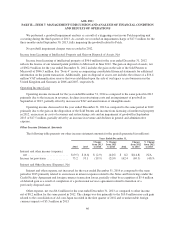
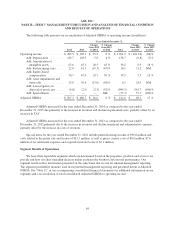
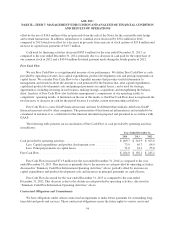
Adjusted OIBDA
We use Adjusted OIBDA as a supplemental measure of our performance. We define Adjusted OIBDA as
operating income before depreciation and amortization excluding the impact of restructuring costs, non-cash
equity-based compensation, gains and losses on all disposals of assets, non-cash asset impairments and write-offs
and special items. We consider Adjusted OIBDA to be a useful metric for management and investors to evaluate
and compare the ongoing operating performance of our business on a consistent basis across reporting periods, as
it eliminates the effect of non-cash items such as depreciation of tangible assets, amortization of intangible assets
that were primarily recognized in business combinations, asset impairments and write-offs, as well as the effect
of restructurings, gains and losses on asset sales and special items, which we do not believe are indicative of our
core operating performance. We exclude the impacts of equity-based compensation to allow us to be more
closely aligned with the industry and analyst community.
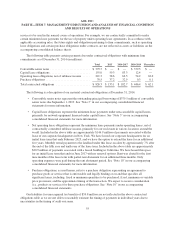
A limitation of this measure, however, is that it does not reflect the periodic costs of capitalized tangible and
intangible assets used in generating revenues in our business or the current or future expected cash expenditures
for restructuring costs. The Adjusted OIBDA measure also does not include equity-based compensation, which is
and will remain a key element of our overall long-term compensation package. Moreover, the Adjusted OIBDA
measure does not reflect gains and losses on asset sales, impairment charges and write-offs related to goodwill,
intangible assets and fixed assets or special items which impact our operating performance. We evaluate the
investments in such tangible and intangible assets through other financial measures, such as capital expenditure
budgets, investment spending levels and return on capital.
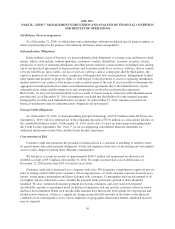
Adjusted OIBDA is not a financial measure under U.S. generally accepted accounting principles (“GAAP”)
and may be different than similarly-titled non-GAAP financial measures used by other companies. The
presentation of this financial information is not intended to be considered in isolation or as a substitute for the
financial information prepared and presented in accordance with GAAP.
47