Alpine 2015 Annual Report Download - page 3
Download and view the complete annual report
Please find page 3 of the 2015 Alpine annual report below. You can navigate through the pages in the report by either clicking on the pages listed below, or by using the keyword search tool below to find specific information within the annual report.-
 1
1 -
 2
2 -
 3
3 -
 4
4 -
 5
5 -
 6
6 -
 7
7 -
 8
8 -
 9
9 -
 10
10 -
 11
11 -
 12
12 -
 13
13 -
 14
14 -
15
-
16
-
17
-
18
-
19
-
20
 |
 |

- 2 -
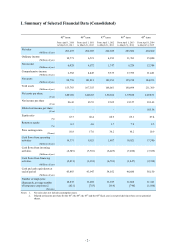
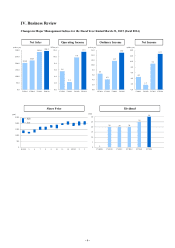
I. Summary of Selected Financial Data (Consolidated)
45th term 46th term 47th term 48th term 49th term
From April 1, 2010
to March 31, 2011
From April 1, 2011
to March 31, 2012
From April 1, 2012
to March 31, 2013
From April 1, 2013
to March 31, 2014
From April 1, 2014
to March 31, 2015
Net sales
(Millions of yen) 201,257 202,905 222,309 285,884 294,560
Ordinary income
(Millions of yen) 10,771 6,521 4,291 11,763 15,000
Net income
(Millions of yen) 6,029 4,572 1,747 9,229 12,704
Comprehensive income
(Millions of yen) 2,382 4,445 9,533 17,399 21,641
Net assets
(Millions of yen) 98,759 101,811 109,991 125,218 144,223
Total assets
(Millions of yen) 153,783 167,355 168,061 190,694 211,309
Net assets per share
(Yen) 1,403.69 1,448.63 1,562.62 1,778.00 2,058.51
Net income per share
(Yen) 86.43 65.53 25.05 132.27 183.42
Diluted net income per share
(Yen) –––– 183.38
Equity ratio
(%) 63.7 60.4 64.9 65.1 67.4
Return on equity
(%) 6.2 4.6 1.7 7.9 9.5
Price earnings ratio
(Times) 10.8 17.0 36.2 10.2 10.9
Cash flows from operating
activities
(Millions of yen)
14,371 9,921 1,607 18,021 17,380
Cash flows from investing
activities
(Millions of yen)
(4,349) (7,710) (6,023) (7,206) (7,529)
Cash flows from financing
activities
(Millions of yen)
(5,411) (1,381) (6,701) (1,447) (2,330)
Cash and cash equivalents at
end of period
(Millions of yen)
43,883 43,947 34,052 46,680 56,130
Number of employees
[Separately, average number
of temporary employees]
(Persons)
10,835
[621]
11,058
[703]
11,107
[919]
11,608
[790]
11,343
[1,106]
Notes: 1. Net sales does not include consumption taxes.
2. Diluted net income per share for the 45th, the 46th, the 47th and the 48th fiscal year is not provided since there are no potential
shares.