Alpine 2008 Annual Report Download - page 5
Download and view the complete annual report
Please find page 5 of the 2008 Alpine annual report below. You can navigate through the pages in the report by either clicking on the pages listed below, or by using the keyword search tool below to find specific information within the annual report.-
 1
1 -
 2
2 -
 3
3 -
 4
4 -
 5
5 -
 6
6 -
 7
7 -
 8
8 -
 9
9 -
 10
10 -
 11
11 -
 12
12 -
 13
13 -
 14
14 -
 15
15 -
 16
16 -
17
-
18
-
19
-
20
-
21
-
22
-
23
-
24
-
25
-
26
-
27
-
28
-
29
-
30
-
31
-
32
-
33
-
34
-
35
-
36
-
37
-
38
-
39
-
40
 |
 |

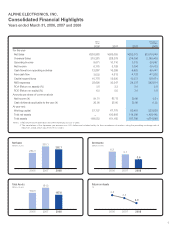
Total Assets
(Billions of yen)
2006
169.6
2007
181.2
2008
167.8
For the year
Net Sales
Overseas Sales
Operating Income
Net Income
Cash flows from operating activities
Free cash flow
Capital expenditures
R&D expenses
ROA (Return on assets) (%)
ROE (Return on equity) (%)
Amounts per share of common stock
Net Income (¥)
Cash dividends applicable to the year (¥)
At year-end
Working capital
Total net assets
Total assets
2007
¥265,055
228,379
10,110
5,729
16,399
4,512
12,620
30,347
3.3
5.0
82.12
25.00
61,175
120,908
181,185
2006
¥253,983
215,281
9,671
6,175
12,887
3,032
10,778
28,695
3.8
6.2
91.71
20.00
57,737
-
169,553
millions
of yen
2008
$2,515,940
2,186,406
69,987
35,473
99,441
-41,302
136,471
292,814
2.0
3.0
0.51
0.25
553,858
1,160,445
1,674,668
thousands of
U.S.Dollars
2008
¥252,072
219,056
7,012
3,554
9,963
-4,138
13,673
29,337
2.0
3.0
50.95
25.00
55,491
116,265
167,785
millions
of yen thousands of
U.S.Dollars
For the year
Net Sales
Overseas Sales
Operating Income
Net Income
Cash flows from operating activities
Free cash flow
Capital expenditures
R&D expenses
ROA (Return on assets) (%)
ROE (Return on equity) (%)
2006
¥253,983
215,281
9,671
6,175
12,887
3,032
10,778
28,695
3.8
6.2
2007
¥265,055
228,379
10,110
5,729
16,399
4,512
12,620
30,347
3.3
5.0
2008
¥252,072
219,056
7,012
3,554
9,963
-4,138
13,673
29,337
2.0
3.0
2008
$2,515,940
2,186,406
69,987
35,473
99,441
-41,302
136,471
292,814
2.0
3.0
Amounts per share of common stock
Net Income (¥)
Diluted net income (¥)
Cash dividends applicable to the year (¥)
At year-end
Working capital
Total stockholders’ equity
Total net assets
Total assets
2006
91.71
88.35
20.00
57,737
110,782
-
169,553
2007
82.12
-
25.00
61,175
-
120,908
181,185
2008
50.95
-
25.00
55,491
-
116,265
167,785
2008
0.51
-
0.25
553,858
-
1,160,445
1,674,668
millions
of yen thousands of
U.S.Dollars
Notes: 1. R&D expenses include labor and other expenses as cost of sales
2. The translations of the Japanese yen amounts into U.S. dollars are included solely for the convenience of readers, using the prevailing exchange rate
at March 31, 2008, which was ¥100.19 to U.S.$1.
millions
of yen thousands of
U.S.Dollars
For the year
Net Sales
Overseas Sales
Operating Income
Net Income
Cash flows from operating activities
Free cash flow
Capital expenditures
R&D expenses
ROA (Return on assets) (%)
ROE (Return on equity) (%)
2006
¥253,983
215,281
9,671
6,175
12,887
3,032
10,778
28,695
3.8
6.2
2007
¥265,055
228,379
10,110
5,729
16,399
4,512
12,620
30,347
3.3
5.0
2008
¥252,072
219,056
7,012
3,554
9,963
-4,138
13,673
29,337
2.0
3.0
2008
$2,515,940
2,186,406
69,987
35,473
99,441
-41,302
136,471
292,814
2.0
3.0
Amounts per share of common stock
Net Income (¥)
Diluted net income (¥)
Cash dividends applicable to the year (¥)
At year-end
Working capital
Total stockholders’ equity
Total net assets
Total assets
2006
91.71
88.35
20.00
57,737
110,782
-
169,553
2007
82.12
-
25.00
61,175
-
120,908
181,185
2008
50.95
-
25.00
55,491
-
116,265
167,785
2008
0.51
-
0.25
553,858
-
1,160,445
1,674,668
millions
of yen thousands of
U.S.Dollars
Notes: 1. R&D expenses include labor and other expenses as cost of sales
2. The translations of the Japanese yen amounts into U.S. dollars are included solely for the convenience of readers, using the prevailing exchange rate
at March 31, 2008, which was ¥100.19 to U.S.$1.
Notes: 1. R&D expenses include labor and other expenses as cost of sales
2. The translations of the Japanese yen amounts into U.S. dollars are included solely for the convenience of readers, using the prevailing exchange rate at
March 31, 2008, which was ¥100.19 to U.S.$1.
Return on Assets
(%)
2006
3.8%
2007
3.3%
2008
2.0%
ALPINE ELECTRONICS, INC.
Consolidated Financial Highlights
Years ended March 31, 2006, 2007 and 2008
Net Sales
(Billions of yen)
Net Income
(Billions of yen)
2006
6.2
2007
5.7
2008
3.6
Net Income
(Billions of yen)
Total Assets
(Billions of yen)
Return on Assets
(%)
Net Sales
(Billions of yen)
2006
254.0
2007
265.1
2008
252.1
2006 2007 2008
167.8
181.2
169.6
2006 2007 2008
252.1
265.1
254.0
2006 2007 2008
3.6
5.7
6.2
2006 2007 2008
2.0
3.3
3.8
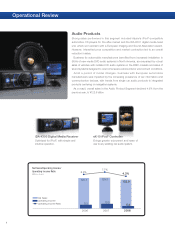
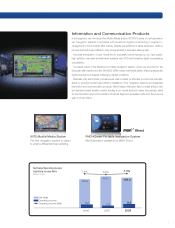
5