Alcoa 2015 Annual Report Download - page 11
Download and view the complete annual report
Please find page 11 of the 2015 Alcoa annual report below. You can navigate through the pages in the report by either clicking on the pages listed below, or by using the keyword search tool below to find specific information within the annual report.-
 1
1 -
 2
2 -
 3
3 -
 4
4 -
 5
5 -
 6
6 -
 7
7 -
 8
8 -
 9
9 -
 10
10 -
 11
11 -
 12
12 -
 13
13 -
 14
14 -
 15
15 -
 16
16 -
 17
17 -
 18
18 -
 19
19 -
 20
20 -
 21
21 -
 22
22 -
23
-
24
-
25
-
26
-
27
-
28
-
29
-
30
-
31
-
32
-
33
-
34
-
35
-
36
-
37
-
38
-
39
-
40
-
41
-
42
-
43
-
44
-
45
-
46
-
47
-
48
-
49
-
50
-
51
-
52
-
53
-
54
-
55
-
56
-
57
-
58
-
59
-
60
-
61
-
62
-
63
-
64
-
65
-
66
-
67
-
68
-
69
-
70
-
71
-
72
-
73
-
74
-
75
-
76
-
77
-
78
-
79
-
80
-
81
-
82
-
83
-
84
-
85
-
86
-
87
-
88
-
89
-
90
-
91
-
92
-
93
-
94
-
95
-
96
-
97
-
98
-
99
-
100
-
101
-
102
-
103
-
104
-
105
-
106
-
107
-
108
-
109
-
110
-
111
-
112
-
113
-
114
-
115
-
116
-
117
-
118
-
119
-
120
-
121
-
122
-
123
-
124
-
125
-
126
-
127
-
128
-
129
-
130
-
131
-
132
-
133
-
134
-
135
-
136
-
137
-
138
-
139
-
140
-
141
-
142
-
143
-
144
-
145
-
146
-
147
-
148
-
149
-
150
-
151
-
152
-
153
-
154
-
155
-
156
-
157
-
158
-
159
-
160
-
161
-
162
-
163
-
164
-
165
-
166
-
167
-
168
-
169
-
170
-
171
-
172
-
173
-
174
-
175
-
176
-
177
-
178
-
179
-
180
-
181
-
182
-
183
-
184
-
185
-
186
-
187
-
188
-
189
-
190
-
191
-
192
-
193
-
194
-
195
-
196
-
197
-
198
-
199
-
200
-
201
-
202
-
203
-
204
-
205
-
206
-
207
-
208
-
209
-
210
-
211
-
212
-
213
-
214
-
215
-
216
-
217
-
218
-
219
-
220
-
221
 |
 |

07
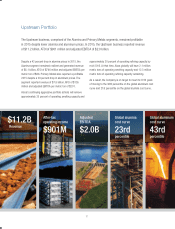
Upstream Portfolio
The Upstream business, comprised of the Alumina and Primary Metals segments, remained profi table
in 2015 despite lower alumina and aluminum prices. In 2015, the Upstream business reported revenue
of $11.2 billion, ATOI of $901 million and adjusted EBITDA of $2.0 billion.
Despite a 43 percent drop in alumina prices in 2015, the
Alumina segment remained resilient and generated revenue
of $5.1 billion, ATOI of $746 million and adjusted EBITDA per
metric ton of $88. Primary Metals also reported a profi table
2015 despite a 28 percent drop in aluminum prices. The
segment reported revenue of $7.8 billion, ATOI of $155
million and adjusted EBITDA per metric ton of $201.
Alcoa’s continuing aggressive portfolio actions will remove
approximately 25 percent of operating smelting capacity and
approximately 20 percent of operating refi ning capacity by
mid-2016. At that time, Alcoa globally will have 2.1 million
metric tons of operating smelting capacity and 12.3 million
metric tons of operating refi ning capacity remaining.
As a result, the Company is on target to meet its 2016 goals
of moving to the 38th percentile on the global aluminum cost
curve and 21st percentile on the global alumina cost curve.
After-tax
operating income
$901M
Adjusted
EBITDA
$2.0B
Global alumina
cost curve
23rd
Global aluminum
cost curve
43rd
Revenue
$11.2B
percentile percentile