Air Canada 2011 Annual Report Download - page 2
Download and view the complete annual report
Please find page 2 of the 2011 Air Canada annual report below. You can navigate through the pages in the report by either clicking on the pages listed below, or by using the keyword search tool below to find specific information within the annual report.-
 1
1 -
 2
2 -
 3
3 -
 4
4 -
 5
5 -
 6
6 -
 7
7 -
 8
8 -
 9
9 -
 10
10 -
 11
11 -
 12
12 -
 13
13 -
14
-
15
-
16
-
17
-
18
-
19
-
20
-
21
-
22
-
23
-
24
-
25
-
26
-
27
-
28
-
29
-
30
-
31
-
32
-
33
-
34
-
35
-
36
-
37
-
38
-
39
-
40
-
41
-
42
-
43
-
44
-
45
-
46
-
47
-
48
-
49
-
50
-
51
-
52
-
53
-
54
-
55
-
56
-
57
-
58
-
59
-
60
-
61
-
62
-
63
-
64
-
65
-
66
-
67
-
68
-
69
-
70
-
71
-
72
-
73
-
74
-
75
-
76
-
77
-
78
-
79
-
80
-
81
-
82
-
83
-
84
-
85
-
86
-
87
-
88
-
89
-
90
-
91
-
92
-
93
-
94
-
95
-
96
-
97
-
98
-
99
-
100
-
101
-
102
-
103
-
104
-
105
-
106
-
107
-
108
-
109
-
110
-
111
-
112
-
113
-
114
-
115
-
116
-
117
-
118
-
119
-
120
-
121
-
122
-
123
-
124
-
125
-
126
-
127
-
128
-
129
-
130
-
131
-
132
-
133
-
134
-
135
-
136
-
137
-
138
-
139
-
140
-
141
-
142
-
143
-
144
-
145
-
146
-
147
-
148
-
149
-
150
 |
 |

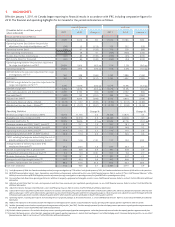
1. HIGHLIGHTS
Effective January 1, 2011, Air Canada began reporting its fi nancial results in accordance with IFRS, including comparative fi gures for
2010. The fi nancial and operating highlights for Air Canada for the periods indicated are as follows.
(Canadian dollars in millions, except
where indicated)
raeY lluFretrauQ htruoF
2011 2010 Change $ 2011 2010 Change $
Financial Performance Metrics
Operating revenues 2,699 2,616 83 11,612 10,786 826
Operating income (loss) before the provision
adjustment for cargo investigations, net(1) (98) 15 (113) 179 232 (53)
Operating income (loss) (98) 61 (159) 179 278 (99)
Non-operating income (loss) 38 28 10 (429) (303) (126)
Income (loss) before income taxes (60) 89 (149) (250) (25) (225)
Net income (loss) for the period (60) 89 (149) (249) (24) (225)
Operating margin before the provision adjustment
for cargo investigations, net %(1) (3.6)% 0.6% (4.2) pp 1.5% 2.2% (0.6) pp
Operating margin % (3.6)% 2.3% (5.9) pp 1.5% 2.6% (1.0) pp
EBITDAR before the provision adjustment for cargo
investigations, net(1) (2) 162 328 (166) 1,242 1,386 (144)
EBITDAR(2) 162 374 (212) 1,242 1,432 (190)
EBITDAR margin before the provision adjustment for
cargo investigation, net %(1) (2) 6.0% 12.6% (6.6) pp 10.7% 12.9% (2.2) pp
EBITDAR margin %(2) 6.0% 14.3% (8.3) pp 10.7% 13.3% (2.6) pp
Cash, cash equivalents and short-term investments 2,099 2,192 (93) 2,099 2,192 (93)
Free cash fl ow(3) (69) 122 (191) 366 746 (380)
Adjusted net debt(4) 4,576 4,874 (298) 4,576 4,874 (298)
Net income (loss) per share – Diluted $ (0.22) $ 0.27 $ (0.49) $ (0.92) $ (0.12) $ (0.80)
Adjusted net loss per share – Diluted(5) $ (0.64) $ (0.17) $ (0.47) $ (0.72) $ (0.58) $ (0.14)
Operating Statistics % egnahC% egnahC
Revenue passenger miles (millions) (RPM) 12,065 11,756 2.6 54,223 51,875 4.5
Available seat miles (millions) (ASM) 15,290 14,918 2.5 66,460 63,496 4.7
Passenger load factor % 78.9% 78.8% 0.1 pp 81.6% 81.7% (0.1) pp
Passenger revenue per RPM (“Yield”) (cents)(6) 19.5 19.1 1.9 18.7 18.1 3.3
Passenger revenue per ASM (“RASM”) (cents)(6) 15.4 15.1 2.0 15.3 14.8 3.2
Operating revenue per ASM (cents)(6) 17.7 17.3 2.2 17.5 17.0 2.9
Operating expense per ASM (“CASM”) (cents) 18.3 17.4 4.9 17.2 16.6 3.5
CASM, excluding fuel expense and excluding the cost of
ground packages at Air Canada Vacations (cents)(7) 12.6 12.8 (1.5) 11.7 12.0 (2.9)
Average number of full-time equivalent (FTE)
employees (thousands)(8) 23.6 23.3 1.5 23.7 23.2 2.1
Aircraft in operating fl eet at period end(9) 331 328 0.9 331 328 0.9
Average fl eet utilization (hours per day)(10) 9.4 9.4 (0.3) 10.1 9.8 2.7
Revenue frequencies (thousands) 133 131 1.3 551 537 2.5
Average aircraft fl ight length (miles)(10) 857 850 0.8 892 868 2.7
Economic fuel price per litre (cents)(11) 88.6 67.5 31.3 85.2 66.4 28.3
Fuel litres (millions) 912 906 0.7 3,937 3,791 3.9
(1) In the fi rst quarter of 2008, Air Canada recorded a provision for cargo investigations of $125 million. In the fourth quarter of 2010, Air Canada recorded a net reduction of $46 million to this provision.
(2) EBITDAR (earnings before interest, taxes, depreciation, amortization and impairment, and aircraft rent) is a non-GAAP fi nancial measure. Refer to section 20 "Non-GAAP Financial Measures" of the
MD&A for a reconciliation of EBITDAR before a provision adjustment for cargo investigations to operating income (loss) and EBITDAR to operating income (loss).
(3) Free cash fl ow (cash fl ows from operating activities less additions to property, equipment and intangible assets) is a non-GAAP fi nancial measure. Refer to section 9.5 of the MD&A for additional
information.
(4) Adjusted net debt (total debt less cash, cash equivalents and short-term investments plus capitalized operating leases) is a non-GAAP fi nancial measure. Refer to section 9.3 of the MD&A for
additional information.
(5) Adjusted net income (loss) per share (diluted) is a non-GAAP fi nancial measure. Refer to section 20 of the MD&A for additional information.
(6) A favourable revenue adjustment of $40 million related to Air Canada’s transatlantic joint venture with United Airlines and Deutsche Lufthansa AG, which was fi nalized in December 2010 but with
effect as of January 1, 2010, and to other interline agreements was recorded in the fourth quarter of 2010. For comparative purposes, these measures were adjusted to exclude the impact of the $40
million favourable adjustment recorded in the fourth quarter of 2010, which related to activities attributable to the fi rst three quarters of 2010.
(7) Operating expense, excluding fuel expense and excluding the cost of ground packages at Air Canada Vacations, is a non-GAAP fi nancial measure. Refer to section 20 of the MD&A for additional
information.
(8) Refl ects FTE employees at Air Canada. Excludes FTE employees at third party carriers (such as at Jazz Aviation LP (“Jazz”)) operating under capacity purchase agreements with Air Canada.
(9) Includes Jazz aircraft covered under a capacity purchase agreement with Jazz (the “Jazz CPA”). Excludes aircraft operated by other third party carriers pursuant to capacity purchase agreements with
Air Canada. Refer to section 8 of the MD&A for additional information.
(10) Excludes charter operations. Also excludes third party carriers operating under capacity purchase arrangements, other than Jazz aircraft covered under the capacity purchase agreement with Jazz.
(11) Excludes third party carriers, other than Jazz, operating under capacity purchase agreements. Includes fuel handling and is net of fuel hedging results. Economic fuel price per litre is a non-GAAP
fi nancial measure. Refer to sections 6 and 7 of the MD&A for additional information.