Air Canada 2011 Annual Report Download - page 12
Download and view the complete annual report
Please find page 12 of the 2011 Air Canada annual report below. You can navigate through the pages in the report by either clicking on the pages listed below, or by using the keyword search tool below to find specific information within the annual report.-
 1
1 -
 2
2 -
 3
3 -
 4
4 -
 5
5 -
 6
6 -
 7
7 -
 8
8 -
 9
9 -
 10
10 -
 11
11 -
 12
12 -
 13
13 -
 14
14 -
 15
15 -
 16
16 -
 17
17 -
 18
18 -
 19
19 -
 20
20 -
 21
21 -
 22
22 -
23
-
24
-
25
-
26
-
27
-
28
-
29
-
30
-
31
-
32
-
33
-
34
-
35
-
36
-
37
-
38
-
39
-
40
-
41
-
42
-
43
-
44
-
45
-
46
-
47
-
48
-
49
-
50
-
51
-
52
-
53
-
54
-
55
-
56
-
57
-
58
-
59
-
60
-
61
-
62
-
63
-
64
-
65
-
66
-
67
-
68
-
69
-
70
-
71
-
72
-
73
-
74
-
75
-
76
-
77
-
78
-
79
-
80
-
81
-
82
-
83
-
84
-
85
-
86
-
87
-
88
-
89
-
90
-
91
-
92
-
93
-
94
-
95
-
96
-
97
-
98
-
99
-
100
-
101
-
102
-
103
-
104
-
105
-
106
-
107
-
108
-
109
-
110
-
111
-
112
-
113
-
114
-
115
-
116
-
117
-
118
-
119
-
120
-
121
-
122
-
123
-
124
-
125
-
126
-
127
-
128
-
129
-
130
-
131
-
132
-
133
-
134
-
135
-
136
-
137
-
138
-
139
-
140
-
141
-
142
-
143
-
144
-
145
-
146
-
147
-
148
-
149
-
150
 |
 |
2011 Air Canada Annual Report
12
5. OVERVIEW
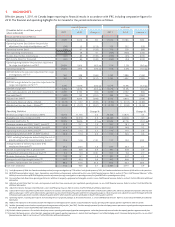
Air Canada’s results of operations for 2011 compared to 2010 are as follows:
Operating income of $179 million decreased $53 million from 2010 while EBITDAR of $1,242 million declined
$144 million, both before a favourable adjustment of $46 million to a provision for cargo investigations in 2010. On a
capacity increase of 4.7%, Air Canada experienced strong revenue growth in the year, driven by increased fares and fuel
surcharges, however the revenue growth was more than offset by an increase in total operating expenses, the result of
significantly higher jet fuel prices year-over-year.
Operating revenues increased $826 million or 8% from 2010, on passenger revenue growth of 8.3%. The growth in
system passenger revenues in 2011 was due to a 4.5% increase in system passenger traffic and a 3.3% improvement in
system yield. In 2011, the impact of a stronger Canadian dollar on foreign currency denominated passenger revenues
reduced system passenger revenues by $64 million while the impact of the Japan earthquake and its aftermath is believed
to have reduced passenger revenues by $28 million. Overall capacity was 4.7% higher than in 2010, reflecting ASM
growth in all markets. This system capacity growth was slightly above the 4.0% to 4.5% full year 2011 ASM capacity
increase projected in Air Canada’s news release dated November 4, 2011 due to fewer weather-related flight
cancellations than previously forecasted. System RASM increased 3.2% year-over-year on the yield growth.
Operating expenses increased $879 million or 8% from 2010, of which $723 million was due to higher fuel expense year-
over-year. Excluding fuel expense and excluding the cost of ground packages at Air Canada Vacations, CASM decreased
2.9% from 2010. CASM, excluding fuel expense and excluding the cost of ground packages at Air Canada Vacations, was
favourably impacted by the following: a stronger Canadian dollar on foreign currency denominated expenses which
reduced operating expenses by $60 million; the 4.7% capacity growth; an increase in both aircraft utilization and stage
length of 2.7%; a decrease in depreciation, amortization and impairment expense; a decrease in wages and salaries; and
the benefits of the airline’s cost transformation program. Partially offsetting these decreases was an increase in employee
benefits expense.
A key element of Air Canada’s business strategy is to consistently improve unit revenue and cost productivity. To this end,
in early 2009, Air Canada launched a major company-wide cost transformation program (the “CTP”) with the objective of
achieving annualized revenue improvements and cost savings of $530 million by the end of 2011. As at September 30,
2011, Air Canada had surpassed this CTP target. Air Canada views continuous cost transformation and improvement as
one of its most important priorities, and a critical objective going forward to support ongoing unit cost improvements.
A net loss of $249 million or $0.92 per diluted share was a deterioration of $225 million from the net loss of $24 million
or $0.12 per diluted share recorded in 2010. The net loss in 2011 included foreign exchange losses of $54 million while
the net loss in 2010 included foreign exchange gains of $184 million, an interest expense charge of $54 million related to
the repayment of the term credit facility, an impairment charge on aircraft of $49 million, and the net favourable
adjustment to the provision for cargo investigations of $46 million.
Free cash of $366 million decreased $380 million from 2010, largely due to a decline in net cash from operations of
$210 million, higher pension payments of $129 million, and a reduction in cash provided by working capital of $79 million.
At December 31, 2011, adjusted net debt of $4,576 million decreased $298 million from December 31, 2010. Debt
repayments of $608 million in 2011 were funded from positive free cash flow of $366 million and the proceeds from new
debt borrowings of $232 million. The favourable impact of foreign exchange on aircraft rent also lowered capitalized
operating lease obligations by $126 million in 2011. Cash, cash equivalents and short-term investments totalled
$2,099 million as at December 31, 2011, representing 18% of twelve-month trailing operating revenues.