Aetna 2013 Annual Report Download - page 9
Download and view the complete annual report
Please find page 9 of the 2013 Aetna annual report below. You can navigate through the pages in the report by either clicking on the pages listed below, or by using the keyword search tool below to find specific information within the annual report.-
 1
1 -
 2
2 -
 3
3 -
 4
4 -
 5
5 -
 6
6 -
 7
7 -
 8
8 -
 9
9 -
 10
10 -
 11
11 -
 12
12 -
 13
13 -
 14
14 -
 15
15 -
 16
16 -
 17
17 -
 18
18 -
 19
19 -
 20
20 -
21
-
22
-
23
-
24
-
25
-
26
-
27
-
28
-
29
-
30
-
31
-
32
-
33
-
34
-
35
-
36
-
37
-
38
-
39
-
40
-
41
-
42
-
43
-
44
-
45
-
46
-
47
-
48
-
49
-
50
-
51
-
52
-
53
-
54
-
55
-
56
-
57
-
58
-
59
-
60
-
61
-
62
-
63
-
64
-
65
-
66
-
67
-
68
-
69
-
70
-
71
-
72
-
73
-
74
-
75
-
76
-
77
-
78
-
79
-
80
-
81
-
82
-
83
-
84
-
85
-
86
-
87
-
88
-
89
-
90
-
91
-
92
-
93
-
94
-
95
-
96
-
97
-
98
-
99
-
100
-
101
-
102
-
103
-
104
-
105
-
106
-
107
-
108
-
109
-
110
-
111
-
112
-
113
-
114
-
115
-
116
-
117
-
118
-
119
-
120
-
121
-
122
-
123
-
124
-
125
-
126
-
127
-
128
-
129
-
130
-
131
-
132
-
133
-
134
-
135
-
136
-
137
-
138
-
139
-
140
-
141
-
142
-
143
-
144
-
145
-
146
-
147
-
148
-
149
-
150
-
151
-
152
-
153
-
154
-
155
-
156
 |
 |

Annual Report- Page 3
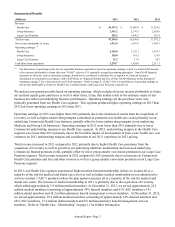
Summarized Results
(Millions) 2013 2012 2011
Revenue:
Health Care $ 44,397.2 $ 33,005.8 $ 31,254.2
Group Insurance 2,341.2 2,147.5 2,026.6
Large Case Pensions 556.2 1,446.5 501.4
Total revenue 47,294.6 36,599.8 33,782.2
Net income attributable to Aetna 1,913.6 1,657.9 1,985.7
Operating earnings: (1)
Health Care 2,130.8 1,752.1 1,955.7
Group Insurance 128.0 161.5 153.0
Large Case Pensions 21.2 17.8 20.7
Cash flows from operations 2,278.7 1,824.9 2,511.1
(1) Our discussion of operating results for our reportable business segments is based on operating earnings, which is a non-GAAP measure
of net income attributable to Aetna (the term “GAAP” refers to U.S. generally accepted accounting principles). Non-GAAP financial
measures we disclose, such as operating earnings, should not be considered a substitute for, or superior to, financial measures
determined or calculated in accordance with GAAP. Refer to “Segment Results and Use of Non-GAAP Measures in this Document”
beginning on page 7 for a discussion of non-GAAP measures. Refer to pages 8, 12 and 14 for a reconciliation of operating earnings to
net income attributable to Aetna for Health Care, Group Insurance and Large Case Pensions, respectively.
We analyze our operating results based on operating earnings, which excludes from net income attributable to Aetna
net realized capital gains and losses as well as other items, if any, that neither relate to the ordinary course of our
business nor reflect our underlying business performance. Operating earnings for the past three years were
primarily generated from our Health Care segment. This segment produced higher operating earnings in 2013 than
2012 but lower operating earnings in 2012 than 2011.
Operating earnings in 2013 were higher than 2012 primarily due to the inclusion of results from the acquisition of
Coventry, as well as higher underwriting margins (calculated as premiums less health care costs) primarily in our
underlying Commercial Health Care business, partially offset by lower underwriting margins in our underlying
Medicare and Group Life businesses. Operating earnings in 2012 were lower than 2011 primarily due to lower
Commercial underwriting margins in our Health Care segment. In 2012, underwriting margins in the Health Care
segment were lower than 2011 primarily due to the favorable impact of development of prior-years' health care cost
estimates on 2011 underwriting margins and consideration of our 2011 experience in 2012 pricing.
Total revenue increased in 2013 compared to 2012 primarily due to higher Health Care premiums from the
acquisition of Coventry as well as growth in our underlying Medicare membership and increased underlying
Commercial Insured premium yields, partially offset by lower group annuity conversion premium in our Large Case
Pensions segment. Total revenue increased in 2012 compared to 2011 primarily due to an increase in Commercial
Health Care premium and fees and other revenue as well as a group annuity conversion premium in our Large Case
Pensions segment.
In 2013, our Health Care segment experienced higher medical Insured membership (where we assume all or a
majority of the risk for medical and dental care costs) as well as higher medical membership in our administrative
services contract (“ASC”) products (where the plan sponsor assumes all or a majority of the risk for medical and
dental care costs). The increase in medical membership in 2013 is primarily due to the acquisition of Coventry,
which added approximately 3.8 million medical members. At December 31, 2013, we served approximately 22.2
million medical members (consisting of approximately 39% Insured members and 61% ASC members), 14.1
million dental members and 14.2 million pharmacy benefit management services members. At December 31, 2012,
we served approximately 18.2 million medical members (consisting of approximately 32% Insured members and
68% ASC members), 13.6 million dental members and 8.8 million pharmacy benefit management services
members. Refer to “Health Care - Membership” on page 11 for further information.