Aer Lingus 2014 Annual Report Download - page 3
Download and view the complete annual report
Please find page 3 of the 2014 Aer Lingus annual report below. You can navigate through the pages in the report by either clicking on the pages listed below, or by using the keyword search tool below to find specific information within the annual report.-
 1
1 -
 2
2 -
 3
3 -
 4
4 -
 5
5 -
 6
6 -
 7
7 -
 8
8 -
 9
9 -
 10
10 -
 11
11 -
 12
12 -
 13
13 -
 14
14 -
15
-
16
-
17
-
18
-
19
-
20
-
21
-
22
-
23
-
24
-
25
-
26
-
27
-
28
-
29
-
30
-
31
-
32
-
33
-
34
-
35
-
36
-
37
-
38
-
39
-
40
-
41
-
42
-
43
-
44
-
45
-
46
-
47
-
48
-
49
-
50
-
51
-
52
-
53
-
54
-
55
-
56
-
57
-
58
-
59
-
60
-
61
-
62
-
63
-
64
-
65
-
66
-
67
-
68
-
69
-
70
-
71
-
72
-
73
-
74
-
75
-
76
-
77
-
78
-
79
-
80
-
81
-
82
-
83
-
84
-
85
-
86
-
87
-
88
-
89
-
90
-
91
-
92
-
93
-
94
-
95
-
96
-
97
-
98
-
99
-
100
-
101
-
102
-
103
-
104
-
105
-
106
-
107
-
108
-
109
-
110
-
111
-
112
-
113
-
114
-
115
-
116
-
117
-
118
-
119
-
120
-
121
-
122
-
123
-
124
-
125
-
126
-
127
-
128
-
129
-
130
-
131
-
132
-
133
-
134
-
135
-
136
-
137
-
138
-
139
-
140
-
141
-
142
-
143
-
144
-
145
-
146
 |
 |
1
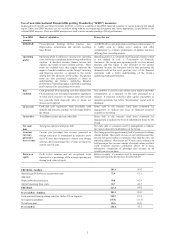
Financial Highlights
For the year ended 31 December 2014
Results
2014
2013
Change 1
Revenue
€m
1,556.9
1,425.1
9.2%
EBITDAR (2)
€m
227.6
189.2
20.3%
Operating profit before net exceptional items (2)
€m
72.0
61.1
17.8%
Net exceptional items
€m
(180.3)
(17.4)
n/m(3)
Operating (loss)/ profit after net exceptional items (2)
€m
(108.4)
43.8
(347.5%)
Net finance expense
€m
(3.8)
(4.2)
9.5%
Share of profit/(loss) in joint venture
€m
0.6
-
n/m(3)
Income tax credit/ (charge)
€m
15.7
(5.5)
385.3%
(Loss)/ profit for the year
€m
(95.8)
34.1
(381.0%)
Total equity
€m
660.6
852.8
(22.5%)
(Loss)/ profit per share
€cent
(18.0)
6.4
(381.0%)
Gross cash (2) (5)
€m
935.5
897.4
4.2%
Gross debt (2)
€m
390.2
477.6
18.3%
Net cash (2)
€m
545.3
419.8
29.9%
Key financial statistics
Average fare revenue per seat
€
98.93
90.43
9.4%
Average fare revenue per passenger
€
131.17
121.62
7.9%
Passenger fare revenue per ASK
€cent/
ASK
6.29
6.19
1.6%
EBITDAR margin
%
14.6%
13.3%
1.3
ppts
Operating margin
%
4.6%
4.3%
0.3
ppts
Return on equity (ROE) (2)
%
9.1%
6.7%
2.4
ppts
Key operating statistics (4)
Passengers carried
'000's
9,766
9,625
1.5%
Revenue Passenger Kilometres (RPK)
m
16,088
14,807
8.7%
Available Seat Kilometres (ASK)
m
20,373
18,898
7.8%
Passenger load factor
%
79.0%
78.4%
0.6
ppts
The trading results set out above and within certain tables in this document are presented in euro rounded to the nearest thousand;
therefore discrepancies in the tables between totals and the sum of the amounts listed may occur due to such rounding.
1 Sign convention: favourable / (adverse)
2 These metrics are defined in the explanation on the use of non-IFRS measures later in this document
3 Not meaningful
4 Key operating statistics relate to mainline operations and exclude Aer Lingus Regional and contract flying activities
5 Gross cash includes restricted cash of €211.7 million, of which €190.7 million relates to the once-off pension solution placed
in escrow as at 31 December 2014 and which will be released over time on the receipt of correctly executed waivers by current
and former employees