Activision 2011 Annual Report Download - page 5
Download and view the complete annual report
Please find page 5 of the 2011 Activision annual report below. You can navigate through the pages in the report by either clicking on the pages listed below, or by using the keyword search tool below to find specific information within the annual report.-
 1
1 -
 2
2 -
 3
3 -
 4
4 -
 5
5 -
 6
6 -
 7
7 -
 8
8 -
 9
9 -
 10
10 -
 11
11 -
 12
12 -
 13
13 -
 14
14 -
 15
15 -
 16
16 -
17
-
18
-
19
-
20
-
21
-
22
-
23
-
24
-
25
-
26
-
27
-
28
-
29
-
30
-
31
-
32
-
33
-
34
-
35
-
36
-
37
-
38
-
39
-
40
-
41
-
42
-
43
-
44
-
45
-
46
-
47
-
48
-
49
-
50
-
51
-
52
-
53
-
54
-
55
-
56
-
57
-
58
-
59
-
60
-
61
-
62
-
63
-
64
-
65
-
66
-
67
-
68
-
69
-
70
-
71
-
72
-
73
-
74
-
75
-
76
-
77
-
78
-
79
-
80
-
81
-
82
-
83
-
84
-
85
-
86
-
87
-
88
-
89
-
90
-
91
-
92
-
93
-
94
 |
 |

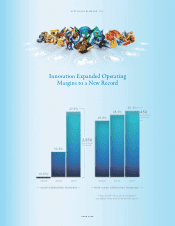
PAGE TH R EE
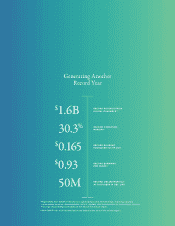
Innovation Drove Record
Earnings Per Share
ACTIVISION BLIZZARD, INC.
$0.09
2009 2009
$0.69
$0.33
2010 2010
$0.79
$0.92
2011 2011
$0.93
— GAAP EARNINGS PER SHARE —
DILUTED
— NON-GAAP EARNINGS PER SHARE(1) —
DILUTED
220%
CAGR
2009–2011
16%
CAGR
2009–2011
(1)Non-GAAP—for a full reconciliation
see tables at the end of the annual report.