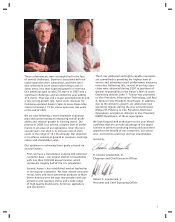
Aarons 2007 Annual Report Download - page 3
Download and view the complete annual report
Please find page 3 of the 2007 Aarons annual report below. You can navigate through the pages in the report by either clicking on the pages listed below, or by using the keyword search tool below to find specific information within the annual report.-
 1
1 -
 2
2 -
 3
3 -
 4
4 -
 5
5 -
 6
6 -
 7
7 -
 8
8 -
 9
9 -
 10
10 -
 11
11 -
 12
12 -
 13
13 -
 14
14 -
15
-
16
-
17
-
18
-
19
-
20
-
21
-
22
-
23
-
24
-
25
-
26
-
27
-
28
-
29
-
30
-
31
-
32
-
33
-
34
-
35
-
36
-
37
-
38
-
39
-
40
-
41
-
42
-
43
-
44
-
45
-
46
-
47
-
48
-
49
-
50
-
51
-
52
 |
 |

1
1
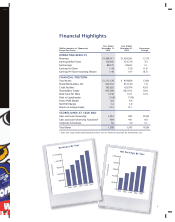
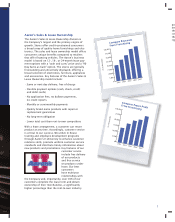
Revenues By Year
Net Earnings By Year
Year Ended Year Ended
(Dollar Amounts in Thousands, December 31, December 31, Percentage
Except Per Share) 2007 2006 Change
OPERATING RESULTS
Revenues $1,494,911 $1,326,592 12.7%
Earnings Before Taxes 128,845 124,710 3.3
Net Earnings 80,275 78,635 2.1
Earnings Per Share 1.48 1.50 (1.3)
Earnings Per Share Assuming Dilution 1.46 1.47 (0.7)
FINANCIAL POSITION
Total Assets $1,113,176 $ 979,606 13.6%
Rental Merchandise, Net 623,452 612,149 1.8
Credit Facilities 185,832 129,974 43.0
Shareholders’ Equity 673,380 607,015 10.9
Book Value Per Share 12.56 11.21 12.0
Debt to Capitalization 21.6% 17.6%
Pretax Profit Margin 8.6 9.4
Net Profit Margin 5.4 5.9
Return on Average Equity 12.5 15.1
STORES OPEN AT YEAR END
Sales and Lease Ownership 1,014 845 20.0%
Sales and Lease Ownership Franchised* 484 441 9.8
Corporate Furnishings 62 59 5.1
Total Stores 1,560 1,345 16.0%
Financial Highlights
* Sales and Lease Ownership franchised stores are not owned or operated by Aaron Rents, Inc.
0
20,000
40,000
60,000
80,000
$100,000
0
300,000
600,000
900,000
1,200,000
$1,500,000
2003 2004 2005 2006 2007
($ in thousands)
2003 2004 2005 2006 2007
($ in thousands)