Aarons 1999 Annual Report Download - page 3
Download and view the complete annual report
Please find page 3 of the 1999 Aarons annual report below. You can navigate through the pages in the report by either clicking on the pages listed below, or by using the keyword search tool below to find specific information within the annual report.-
 1
1 -
 2
2 -
 3
3 -
 4
4 -
 5
5 -
 6
6 -
 7
7 -
 8
8 -
 9
9 -
 10
10 -
 11
11 -
 12
12 -
 13
13 -
 14
14 -
15
-
16
-
17
-
18
-
19
-
20
-
21
-
22
-
23
-
24
-
25
-
26
-
27
-
28
-
29
-
30
-
31
-
32
 |
 |

’95
’96
’97
’98 ’99
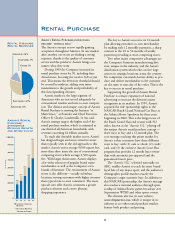
$450,000
400,000
350,000
300,000
250,000
200,000
150,000
100,000
50,000
0
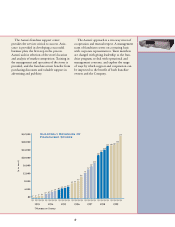
Rent-to-Rent Stores
Company-Operated
Rental Purchase Stores
$30,000
$25,000
20,000
15,000
10,000
5,000
0
’95
’96
’97
’98 ’99
($ in 000’s)($ in 000’s)
1
Year Ended Year Ended
(Dollar Amounts in Thousands, December 31, December 31, Percentage
Except Per Share) 1999 1998 Change
Operating Results
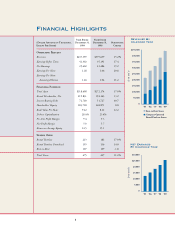
Revenues $437,359 $379,659 15.2%
Earnings Before Taxes 41,302 35,191 17.4
Net Earnings 25,602 21,484 19.2
Earnings Per Share 1.28 1.06 20.8
Earnings Per Share
Assuming Dilution 1.26 1.04 21.2
Financial Position
Total Assets $318,408 $272,174 17.0%
Rental Merchandise, Net 219,831 194,163 13.2
Interest-Bearing Debt 72,760 51,727 40.7
Shareholders’ Equity 183,718 168,871 8.8
Book Value Per Share 9.22 8.22 12.2
Debt to Capitalization 28.4% 23.4%
Pre-Tax Profit Margin 9.4 9.3
Net Profit Margin 5.9 5.7
Return on Average Equity 14.5 15.1
Stores Open
Rental Purchase 213 182 17.0%
Rental Purchase Franchised 155 136 14.0
Rent-to-Rent 107 109 -1.8
Total Stores 475 427 11.2%
Financial Highlights
Revenues By
Calendar Year
Net Earnings
By Calendar Year