ADP 2015 Annual Report Download - page 16
Download and view the complete annual report
Please find page 16 of the 2015 ADP annual report below. You can navigate through the pages in the report by either clicking on the pages listed below, or by using the keyword search tool below to find specific information within the annual report.-
 1
1 -
2
-
3
-
4
-
5
-
 6
6 -
 7
7 -
 8
8 -
 9
9 -
 10
10 -
 11
11 -
 12
12 -
 13
13 -
 14
14 -
 15
15 -
 16
16 -
 17
17 -
 18
18 -
 19
19 -
 20
20 -
 21
21 -
 22
22 -
 23
23 -
 24
24 -
 25
25 -
 26
26 -
27
-
28
-
29
-
30
-
31
-
32
-
33
-
34
-
35
-
36
-
37
-
38
-
39
-
40
-
41
-
42
-
43
-
44
-
45
-
46
-
47
-
48
-
49
-
50
-
51
-
52
-
53
-
54
-
55
-
56
-
57
-
58
-
59
-
60
-
61
-
62
-
63
-
64
-
65
-
66
-
67
-
68
-
69
-
70
-
71
-
72
-
73
-
74
-
75
-
76
-
77
-
78
-
79
-
80
-
81
-
82
-
83
-
84
-
85
-
86
-
87
-
88
-
89
-
90
-
91
-
92
-
93
-
94
-
95
-
96
-
97
-
98
-
99
-
100
-
101
-
102
-
103
-
104
-
105
-
106
-
107
-
108
-
109
-
110
-
111
-
112
 |
 |

Part II
Item 5. Market for Registrant's Common Equity, Related Stockholder Matters and Issuer Purchases of Equity Securities
Market for Registrant's Common Equity
The principal market for the Company’s common stock is the NASDAQ Global Select Market under the symbol ADP. The following table sets forth the
reported high and low sales prices of the Company’s common stock reported on the NASDAQ Global Select Market and the cash dividends per share of common
stock declared during each quarter for the two most recent fiscal years. As of June 30, 2016 , there were 42,827 holders of record of the Company’s common stock.
As of such date, 537,352 additional holders held their common stock in “street name.”
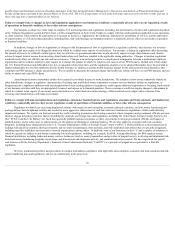
Price Per Share
Dividends
High Low Per Share
Fiscal 2016 quarter ended
June 30 $91.87
$84.36
$0.530
March 31 $90.00
$76.65
$0.530
December 31 $90.67
$78.74
$0.530
September 30 $85.21
$64.29
$0.490
Fiscal 2015 quarter ended
June 30 $88.40
$79.80
$0.490
March 31 $90.23
$81.71
$0.490
December 31 $86.54
$70.50
$0.490
September 30 $84.68
$79.20
$0.480
On September 30, 2014, we spun off our former Dealer Services business to our stockholders. Each of our stockholders of record after the market close on
September 24, 2014 received one share of common stock of CDK Global, Inc. for every three shares of the Company’s common stock. In the table above, stock
prices prior to September 30, 2014 have not been adjusted for the impact of the spin off. Stock prices beginning on October 1, 2014 reflect the impact of the spin
off.
15