3M 2006 Annual Report Download - page 46
Download and view the complete annual report
Please find page 46 of the 2006 3M annual report below. You can navigate through the pages in the report by either clicking on the pages listed below, or by using the keyword search tool below to find specific information within the annual report.-
 1
1 -
2
-
3
-
4
-
5
-
6
-
7
-
8
-
9
-
10
-
11
-
12
-
13
-
14
-
15
-
16
-
17
-
18
-
19
-
20
-
21
-
22
-
23
-
24
-
25
-
26
-
27
-
28
-
29
-
30
-
31
-
32
-
33
-
34
-
35
-
 36
36 -
 37
37 -
 38
38 -
 39
39 -
 40
40 -
 41
41 -
 42
42 -
 43
43 -
 44
44 -
 45
45 -
 46
46 -
 47
47 -
 48
48 -
 49
49 -
 50
50 -
 51
51 -
 52
52 -
 53
53 -
 54
54 -
 55
55 -
 56
56 -
57
-
58
-
59
-
60
-
61
-
62
-
63
-
64
-
65
-
66
-
67
-
68
-
69
-
70
-
71
-
72
-
73
-
74
-
75
-
76
-
77
-
78
-
79
-
80
-
81
-
82
-
83
-
84
-
85
-
86
-
87
-
88
-
89
-
90
-
91
-
92
-
93
-
94
-
95
-
96
-
97
-
98
-
99
-
100
-
101
-
102
-
103
-
104
-
105
-
106
-
107
-
108
-
109
-
110
-
111
-
112
-
113
-
114
-
115
-
116
 |
 |

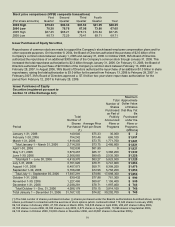
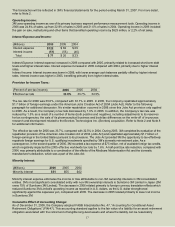
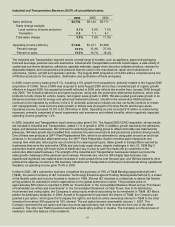
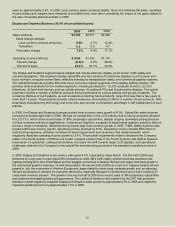
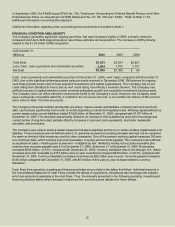
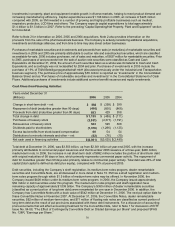
Health Care Business (17.5% of consolidated sales):
2006 2005 2004
Sales (millions) $4,011 $3,760 $3,596
Sales change analysis:
Local currency (volume and price) 6.0% 4.2% 0.6%
Translation 0.7 0.4 4.2
Total sales change 6.7% 4.6% 4.8%
Operating income (millions) $1,845 $1,114
Percent change 65.6% 14.6% 7.2%
Percent of sales 46.0% 29.6% 27.0%
The Health Care segment serves markets that include medical, surgical, pharmaceutical, dental and orthodontic, and
health information systems. Products provided to these and other markets include medical and surgical supplies, skin
health and infection prevention products, pharmaceuticals, drug delivery systems, dental and orthodontic products, health
information systems and microbiology products. As discussed below, the global branded pharmaceuticals business was
sold in December 2006 and January 2007.
In total, the combination of the following items positively impacted total year 2006 Health Care operating income by
$673 million, primarily in the fourth quarter of 2006. As discussed in Note 2, in early December 2006, the Company sold
its branded pharmaceuticals business in the Asia Pacific region, including Australia and South Africa. The Company also
sold its branded pharmaceuticals business in the United States, Canada and Latin America in late December 2006. The
operating income gain related to this sale, which is included in Health Care, totaled $1.074 billion. In addition, as discussed
in Note 4, the Health Care segment for the year 2006 included $293 million in restructuring costs, primarily employee-
related severance and benefit costs. Of the $293 million, $166 million was related to the pharmaceuticals business
and $15 million related to Health Care severance and other costs. In addition, $112 million of severance and benefit
costs were recorded in the fourth quarter of 2006 related to worldwide staff overhead reduction actions taken to
streamline the Company's cost structure in response to the sale of 3M¶VEUDQGHGSKDUPDFHXWLFDOVEXVLQHVV7KH
Health Care business is being charged with these overhead costs until such overhead costs are reduced to zero
through various restructuring actions. These costs will reduce cash flows in 2007 when the related severance is paid.
Health Care also included $95 million of expensed in-process research and development costs related to the Brontes
acquisition and $13 million in environmental reserves related to the pharmaceuticals business.
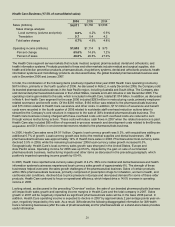
In 2006, Health Care sales were $4.011 billion. Organic local-currency growth was 5.3%, with acquisitions adding an
additional 0.7% of growth. Local-currency growth was lHGE\WKHPHGLFDOVXSSOLHVDQGGHQWDOEXVLQHVVHV0¶V
pharmaceutical business was approximately 19% of Health Care sales in 2006. Pharmaceutical local-currency sales
declined 3.5% in 2006, while the remaining businesseV¶ORFDOFXUUHQF\VDOHVJURZWKLQFUHDVHG
Asia Pacific areas. Operating income for 2006 was up 65.6%, impacted by the gain on sale of our branded
pharmaceuticals business, restructuring impacts and other items as discussed in the preceding paragraph, which
positively impacted operating income growth by 60.4%.
In 2005, Health Care reported local-currency sales growth RI0¶VFRUHPHGLFDODQGGHQWDOEXVLQHVVHVDQGKHDOWK
information systems businesses experienced local-currency sales growth of approximately 6%. The strength of these
businesses helped overcome the sales growth challenges of the pharmaceutical business. Sales of certain products
ZLWKLQ0¶VSKDUPDFHXWLFDOVEXVLQHVVSULPDULO\FRPSULVHGRISUHVFULSWLRQGUXJVIRULQKDODWLRQZRPHQ¶VKHDOWKDQG
cardiovascular conditions, declined due to price pressure in Europe and decreased demand for some of these older
products. Health Care continued to focus on operational efficiency, which helped drive a 14.6% increase in operating
income in 2005.
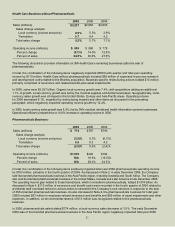
/RRNLQJDKHDGDVGLVFXVVHGLQWKHSUHFHGLQJ³2YHUYLHZ´VHction, the sale of our branded pharmaceuticals business
will impact both sales growth and operating income margins in Health Care and the total company in 2007. Sales
growth in 2007 will be negatively impacted as significant pharmaceuticals sales will be in the base 2006 period. In
addition, Health Care operating income is expected to decline in 2007 by approximately 2 percentage points year-on-
year, negatively impacted by this sale. As a result, 3M believes the following disaggregated information for 3M Health
&DUH¶VUHPDLQLQJEXVLQHVVHVDIWHUWKHVDOHRISKDUPDFHXWicals) and for pharmaceuticals on a stand-alone basis provides
useful information.
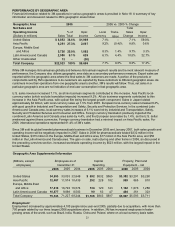
*HRJUDSKLFDOO\+HDOWK&DUH¶VORFDOFXUUHQF\VDOHVJURZWKwas strongest in the United States, Europe and
$ 973