Whole Foods 2014 Annual Report Download - page 9
Download and view the complete annual report
Please find page 9 of the 2014 Whole Foods annual report below. You can navigate through the pages in the report by either clicking on the pages listed below, or by using the keyword search tool below to find specific information within the annual report.-
 1
1 -
 2
2 -
 3
3 -
 4
4 -
 5
5 -
 6
6 -
 7
7 -
 8
8 -
 9
9 -
 10
10 -
 11
11 -
 12
12 -
 13
13 -
 14
14 -
 15
15 -
 16
16 -
 17
17 -
 18
18 -
 19
19 -
 20
20 -
21
-
22
-
23
-
24
-
25
-
26
-
27
-
28
-
29
-
30
-
31
-
32
-
33
-
34
-
35
-
36
-
37
-
38
-
39
-
40
-
41
-
42
-
43
-
44
-
45
-
46
-
47
-
48
-
49
-
50
-
51
-
52
-
53
-
54
-
55
-
56
-
57
-
58
-
59
-
60
-
61
 |
 |
6
Store Description
We strive to transform food shopping from a chore into a dynamic experience by designing and operating stores with a lively,
inspirational atmosphere, mission-oriented décor and well-trained team members. We offer an exciting product mix that
emphasizes our high quality standards and healthy eating, with a range of choices at every price level, ever-changing selections,
samples, open kitchens, scratch bakeries, hand-stacked produce, bulk departments and extensive prepared foods stations featuring
wood-burning pizza ovens; burrito stations and ethnic foods; juicing and hand-crafted coffee stations; and greens, beans and
grains cooking bars, among others. We also incorporate environmentally sustainable aspects into our store design, and many
stores have bicycle racks and electric vehicle charging stations. Our stores typically include sit-down eating areas and customer
service booths, and some stores offer special services such as chair massage, personal shopping, online ordering and home
delivery. Some stores also offer sit-down wine bars and tap rooms featuring local and/or craft beer and wine, creating a destination
for customer gathering. We believe our stores play a unique role as a third place, besides the home and office, where people can
gather, interact and learn while at the same time discovering the many joys of eating and sharing food.
Our store development work starts early. We conscientiously work to serve our communities through volunteer work, partnerships,
and incorporating community feedback throughout the design process. By tailoring our store size, design, product selection and
pricing to the particular community, we have been able to move into more segments of the market – urban and suburban, domestic
and international. Most of our stores are located in high-traffic shopping areas on premier real estate sites and are either
freestanding or in strip centers. We also have a number of urban stores located in high-density, mixed-use developments. In
selecting store locations, we use an internally developed model to analyze potential sites based on various criteria such as
education levels, population density and income levels within certain drive times. After we have selected a target site, our
development group does a comprehensive site study and sales projection and works with our regional teams to develop
construction and operating cost estimates. Each project must meet an internal Economic Value Added (“EVA®”) hurdle return,
based on our internal weighted average cost of capital, which for new stores generally is expected to be cumulative positive
EVA in five years or less. In its simplest definition, EVA is equivalent to net operating profits after taxes minus a charge on the
cost of invested capital necessary to generate those profits. Our current internal weighted average cost of capital metric is 8%.
The required cash investment for new stores varies depending on the size of the store, geographic location, degree of landlord
incentives and complexity of site development issues. To a significant degree, it also depends on how the project is structured,
including costs for elements that often increase or decrease rent, e.g., lease acquisition costs, shell and/or garage costs, and
landlord allowances. Because of these differences, the average development cost per square foot may vary significantly from
project to project.
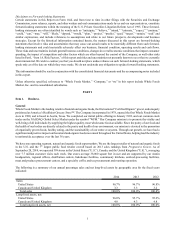
Seasonality
The Company’s average weekly sales and gross profit as a percentage of sales are typically highest in the second and third fiscal
quarters, and lowest in the fourth fiscal quarter due to seasonally slower sales during the summer months. Gross profit as a
percentage of sales is also lower in the first fiscal quarter due to the product mix of holiday sales. For this reason, results in a
quarter are not necessarily indicative of the results that may be achieved in other quarters or for the full fiscal year.
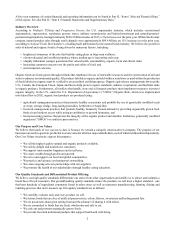
Purchasing and Distribution
The majority of our purchasing occurs at the regional and national levels, enabling us to negotiate better volume discounts with
major vendors and distributors while allowing our store buyers to focus on local products and the unique product mix necessary
to keep the neighborhood market feel in our stores. We also remain committed to buying from local producers who meet our
high quality standards.
Our produce procurement center facilitates the procurement and distribution of the majority of the produce we sell. We also
operate three seafood processing and distribution facilities, a specialty coffee and tea procurement and roasting operation, and
11 regional distribution centers that focus primarily on perishables distribution to our stores across the U.S., Canada and the
U.K. In addition, we have three regional commissary kitchens and five bakehouse facilities, all of which distribute products to
our stores. Other products are typically procured through a combination of specialty wholesalers and direct distributors.
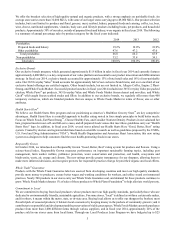
United Natural Foods, Inc. (“UNFI”) is our single largest third-party supplier, accounting for approximately 32% of our total
purchases in fiscal year 2014. Our long-term relationship with UNFI as our primary supplier of dry grocery and frozen food
products extends through 2020.
Store Operations
We strive to promote a strong company culture featuring a team approach to store operations that we believe is distinctly more
empowering to team members than that of the traditional supermarket. Whole Foods Market stores each employ between
approximately 55 and 680 team members who generally comprise 10 self-managed teams per store, each led by a team leader.