Whole Foods 2014 Annual Report Download - page 8
Download and view the complete annual report
Please find page 8 of the 2014 Whole Foods annual report below. You can navigate through the pages in the report by either clicking on the pages listed below, or by using the keyword search tool below to find specific information within the annual report.-
 1
1 -
 2
2 -
 3
3 -
 4
4 -
 5
5 -
 6
6 -
 7
7 -
 8
8 -
 9
9 -
 10
10 -
 11
11 -
 12
12 -
 13
13 -
 14
14 -
 15
15 -
 16
16 -
 17
17 -
 18
18 -
 19
19 -
20
-
21
-
22
-
23
-
24
-
25
-
26
-
27
-
28
-
29
-
30
-
31
-
32
-
33
-
34
-
35
-
36
-
37
-
38
-
39
-
40
-
41
-
42
-
43
-
44
-
45
-
46
-
47
-
48
-
49
-
50
-
51
-
52
-
53
-
54
-
55
-
56
-
57
-
58
-
59
-
60
-
61
 |
 |

5
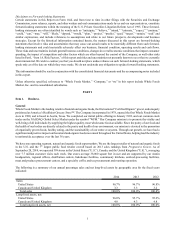
Over the last 15 fiscal years, our comparable store sales growth has averaged 8%, as shown in the following chart. Sales of a
store are deemed to be comparable commencing in the fifty-third full week after the store was opened or acquired. Companies
may define comparable store sales differently; thus growth rates across companies may not be comparable.
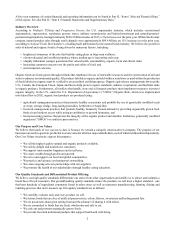
Our growth strategy is to expand primarily through new store openings, and while we may pursue acquisitions of smaller chains
that provide access to desirable geographic areas and experienced team members, such acquisitions are not expected to
significantly impact our future store growth or financial results. We have a disciplined, opportunistic real estate strategy, opening
stores in existing trade areas as well as new areas, including international locations. We typically target premium real estate
sites, and while new stores may be as small as 15,000 square feet or as large as 75,000 square feet, the majority fall in the range
of 35,000 to 45,000 square feet.
Our historical store growth and sales mix for the fiscal years indicated is summarized below:
2014 2013 2012 2011 2010
Stores at beginning of fiscal year 362 335 311 299 284
Stores opened 34 26 25 18 16
Acquired stores 4 6 — — 2
Relocated stores (1) (5) (1) (6) —
Divested or closed stores — — — — (3)
Stores at end of fiscal year 399 362 335 311 299
Stores with major expansions (1) —221—
Total gross square footage at end of fiscal year 15,162,000 13,779,000 12,735,000 11,832,000 11,231,000
Year-over-year growth 10% 8% 8% 5% 6%
(1) Defined as square footage increases of greater than 20% completed during the fiscal year.
2014 2013 2012 2011 2010
Sales mix:
Identical stores (1) 93.3% 93.5% 93.3% 94.6% 93.2%
New and acquired stores, including relocated stores 6.2 5.6 5.4 4.5 5.9
Other retail sales, primarily stores with major expansions 0.2 0.5 0.8 0.5 0.2
Other sales, primarily non-retail external sales 0.3 0.4 0.5 0.4 0.7
Total sales 100.0% 100.0% 100.0% 100.0% 100.0%
(1) Identical store sales do not include sales from new, acquired or relocated stores or stores with major expansions.
Our historical store development pipeline as of the dates indicated is summarized below:
November 5,
2014 November 6,
2013 November 7,
2012 November 2,
2011 November 3,
2010
Stores in development 114 94 79 62 52
Average size (gross square feet) 41,000 38,000 37,000 35,000 39,000
Total gross square footage in development 4,723,000 3,605,000 2,896,000 2,192,000 2,052,000
As a percentage of existing square footage 31% 26% 22% 18% 18%