Western Digital 2012 Annual Report Download - page 4
Download and view the complete annual report
Please find page 4 of the 2012 Western Digital annual report below. You can navigate through the pages in the report by either clicking on the pages listed below, or by using the keyword search tool below to find specific information within the annual report.-
 1
1 -
 2
2 -
 3
3 -
 4
4 -
 5
5 -
 6
6 -
 7
7 -
 8
8 -
 9
9 -
 10
10 -
 11
11 -
 12
12 -
 13
13 -
 14
14 -
 15
15 -
16
-
17
-
18
-
19
-
20
-
21
-
22
-
23
-
24
-
25
-
26
-
27
-
28
-
29
-
30
-
31
-
32
-
33
-
34
-
35
-
36
-
37
-
38
-
39
-
40
-
41
-
42
-
43
-
44
-
45
-
46
-
47
-
48
-
49
-
50
-
51
-
52
-
53
-
54
-
55
-
56
-
57
-
58
-
59
-
60
-
61
-
62
-
63
-
64
-
65
-
66
-
67
-
68
-
69
-
70
-
71
-
72
-
73
-
74
-
75
-
76
-
77
-
78
-
79
-
80
-
81
-
82
-
83
-
84
-
85
-
86
-
87
-
88
-
89
-
90
-
91
-
92
-
93
-
94
-
95
-
96
-
97
-
98
-
99
-
100
-
101
-
102
-
103
-
104
-
105
-
106
-
107
-
108
-
109
-
110
-
111
-
112
-
113
-
114
-
115
-
116
 |
 |

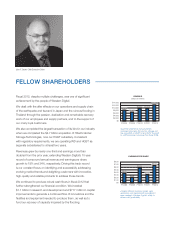
A total of 16.4 million Western Digital common shares were
repurchased during the scal year at a cost of $604 million under
the plan approved by the Board of Directors. In May 2012, we
announced an authorization to repurchase an additional $1.5 billion
of our stock. In September 2012, we announced the declaration of
a quarterly cash dividend of $.25 per share and the authorization of
an additional $1.5 billion under our share repurchase program.
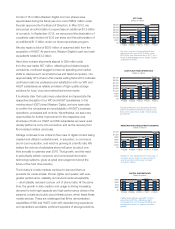
We also repaid a total of $585 million of assumed debt from the
acquisition of HGST. At year’s end, Western Digital’s cash and cash
equivalents totaled $3.2 billion.
Hard drive industry shipments slipped to 599 million units
from the year-earlier 657 million, re ecting ood-related supply
constraints, continued sluggish consumer spending and market
shifts to devices such as smartphones and tablet computers. Our
approximately 45% share in this market exiting scal 2012 indicates
continued customer preference and satisfaction with our WD and
HGST subsidiaries as reliable providers of high-quality storage
solutions for local, cloud and networked environments.
It is already clear that customers understand and appreciate the
respective strengths of our WD and HGST subsidiaries. In the
months since HGST joined Western Digital, we have been able
to con rm the robustness and predictability of HGST’s business
operations, processes and controls. Nevertheless, we see many
opportunities for further improvement in the respective cost
structures of both our HGST and WD subsidiaries as newer areal
density platforms come into production and as the recovery from
ood related matters concludes.
Storage continues to be critical to the mass of digital content being
created and utilized in entertainment, in education, in commerce
and in communication, and which is growing at a terri c rate. We
believe the volume of petabytes stored will grow by about one-
third annually to calendar year 2016. That growth, and the need
to periodically refresh consumer and commercial information
technology systems, gives us great encouragement about the
future of the hard drive industry.
The industry’s mobile markets continue to demand that our
products be made smaller, thinner, lighter and quieter, with ever-
greater performance, reliability and environmental acceptability
— all at steadily reduced cost per unit of stored data. At the same
time, the growth in data creation and usage is driving increasing
demand for both high-capacity and high-performance drives in the
personal, private and public cloud infrastructure, which feeds these
mobile devices. These are challenges that t the demonstrated
capabilities of WD and HGST, both with decades-long experience
and reputations as reliable, preferred suppliers of storage solutions.
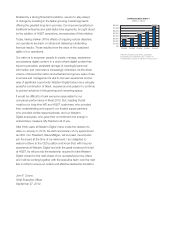
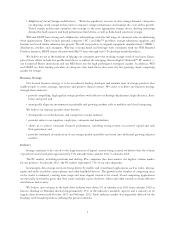
$0
$500
$1,000
$1,500
$2,000
$2,500
$3,000
$3,500
FY2008 FY2009 FY2010 FY2011 FY2012
$1,023
$595
$1,312
$2,334
NET CASH
Dollars in millions
$3,196
Net cash (cash and cash equivalents less
debt) ended the year at $1.0 billion, down
$2.2 billion from the end of scal 2011, as a
result of debt entered into for the $4.7 billion
acquisition of HGST.
$0
$400
$800
$1,200
$1,600
$2,000
$2,400
$2,800
$3,200
FY2008 FY2009 FY2010 FY2011 FY2012
$1,655
$3,067
$1,399 $1,305
$1,942
CASH FLOW FROM OPERATIONS
Dollars in millions
Strong pro tability and disciplined balance
sheet management produced robust cash
ows from operations of $3.1 billion during
scal 2012.
$0
$200
$400
$600
$800
FY2008 FY2009 FY2010 FY2011 FY2012
CAPITAL EXPENDITURES
Dollars in millions
$615 $519
$778 $717
$737
Capital expenditures were $717 million
during scal 2012 as Western Digital
recovered from the Thailand ooding and
continued to invest to support its future
growth.
$0
$200
$400
$600
$800
$1,000
$1,200
FY2008 FY2009 FY2010 FY2011 FY2012
$611 $703
$1,055
$464 $509
RESEARCH AND DEVELOPMENT SPENDING
Dollars in millions
Research and development continues to
increase as we invest in new products
and innovative technology to meet
customer needs.