Western Digital 1995 Annual Report Download - page 14
Download and view the complete annual report
Please find page 14 of the 1995 Western Digital annual report below. You can navigate through the pages in the report by either clicking on the pages listed below, or by using the keyword search tool below to find specific information within the annual report.-
 1
1 -
2
-
3
-
 4
4 -
 5
5 -
 6
6 -
 7
7 -
 8
8 -
 9
9 -
 10
10 -
 11
11 -
 12
12 -
 13
13 -
 14
14 -
 15
15 -
 16
16 -
 17
17 -
 18
18 -
 19
19 -
 20
20 -
 21
21 -
 22
22 -
 23
23 -
 24
24 -
25
-
26
-
27
-
28
-
29
-
30
-
31
-
32
-
33
-
34
-
35
 |
 |

.
Unless otherwise indicated, references hereinafter to specific years and
quarters are to the Company’s fiscal years and to fiscal quarters.
R O:
Comparison of 1995, 1994 and 1993
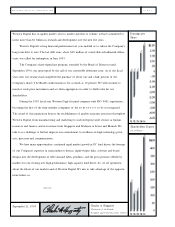
The Company reported net income of $123.3 million for 1995 compared with
net income of $73.1 million for 1994 and a net loss of $25.1 million for 1993.
The increase in net income in 1995 over 1994 resulted from a 38% increase in
revenues, a reduction in operating expenses as a percentage of revenues, and higher
net interest and other income. Partially offsetting these improvements was an
approximately two percentage point decline in gross profit margin. The improved
operating results from 1993 to 1994 resulted from a 26% increase in revenues and
an improvement in gross margin of approximately six percentage points.
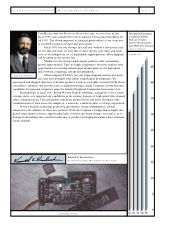
Sales of hard drive products were $1.9, $1.4, and $1.0 billion in 1995,
1994 and 1993, respectively. During 1995, unit shipments increased 49% which,
combined with a modest decline in average selling prices (“ASPs”), resulted in hard
drive revenues increasing 41% from 1994. Increased business with original equip-
ment manufacturers (“OEMs”) during 1995 accounted for the majority of the
increase in unit shipments. During 1994, unit shipments increased 56% from
1993, but declining ASPs reduced the 1993 to 1994 hard drive revenue growth
rate to 32%. The revenue increase in 1994 resulted primarily from increased busi-
ness in the retail and distribution channels.
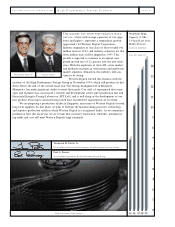
Sales of microcomputer products were $191.0, $160.0 and $178.0 million
in 1995, 1994 and 1993, respectively. Year-to-year variations in microcomputer
product sales were generally attributable to product introduction cycles.
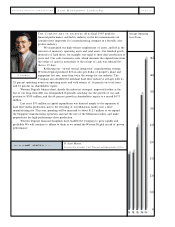
Gross profit margins were as follows:
1995 1994 1993
Hard drive products 16.2% 19.1% 15.3%
Microcomputer products 41.8% 33.7% 12.5%
Overall 18.5% 20.6% 14.9%
During 1995, the Company increased its shipments of hard drive products
to OEMs, which typically require lower prices and a broader product mix (includ-
ing lower capacity hard drives) in exchange for high volumes. Overall hard drive
industry conditions also became more competitive during 1995 as the industry’s
manufacturing capacity more closely matched demand and competitors continued
to shorten product development cycles. These were the primary factors which con-
tributed to the decline in hard drive product gross margin during 1995.