Wacom 2009 Annual Report Download - page 4
Download and view the complete annual report
Please find page 4 of the 2009 Wacom annual report below. You can navigate through the pages in the report by either clicking on the pages listed below, or by using the keyword search tool below to find specific information within the annual report.-
 1
1 -
 2
2 -
 3
3 -
 4
4 -
 5
5 -
 6
6 -
 7
7 -
 8
8 -
 9
9 -
 10
10 -
 11
11 -
 12
12 -
 13
13 -
 14
14 -
 15
15 -
16
-
17
-
18
-
19
-
20
-
21
-
22
-
23
-
24
-
25
-
26
-
27
-
28
-
29
-
30
-
31
-
32
-
33
-
34
-
35
-
36
-
37
-
38
-
39
-
40
-
41
-
42
 |
 |

3
The key to our success
Business Model
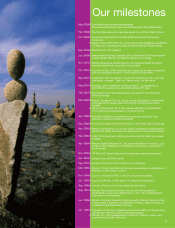
Our milestones
Our Business
Board of Directors/Corporate Governance
Financial Section
Corporate Data
Investor Information
3
4
17
18
39
40
8
9
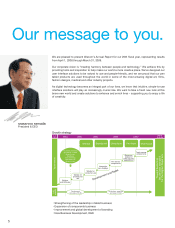
5Our message to you.
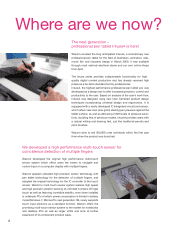
Where are we now?
11
Our global model 15
DISCLAIMER
Contents
0
5,000
10,000
15,000
20,000
25,000
30,000
35,000
0
500
1,000
1,500
2,000
2,500
3,000
3,500
3,501
2,579
0
5,000
10,000
15,000
20,000
25,000
30,000
0
5,000
10,000
15,000
20,000
944
2,146
21,033
25,152
29,221
25,631
(Millions of yen)(Millions of yen)(Millions of yen)
(Millions of yen)
Wacom Co., Ltd. and Its Subsidiaries
Years ended March 31
For the year:
Net sales
Gross profit
Operating income
Net income
At year end:
Total assets
Total net assets
Per share (yen and U.S. dollars) :
Net income
Primary
Diluted
Cash dividends applicable to the year
¥33,809,138
16,761,164
4,311,378
2,579,025
17,796,487
¥ 6,213.93
6,197.78
3,000.00
$344,183
170,632
43,891
26,255
$260,929
181,172
$ 63.26
63.09
30.54
¥36,739,196
18,640,355
5,538,871
3,501,360
¥29,221,330
18,516,742
¥ 8,348.74
8,304.38
2,500.00
2008 2009 2009
Thousands of yen
Thousands of
U.S. dollars*
*Note 1: U.S. dollar amounts h ave been translated from yen, for convenience only, at the rate of ¥98.23=U.S.$1, the approxima te exchange rate
March 31, 2009 .
17,651
’05 ’06 ’07 ’08
36,739
33,809
’09 ’05 ’06 ’07 ’08 ’09 ’05 ’06 ’07 ’08 ’09 ’05 ’06 ’07 ’08 ’09
Net sales Net income Total assets Total net assets
6,699
13,288
16,320
Financial Highlights
prevailing on
17,796
2,853
The key to our success
18,516
23,992
28,787
14,109
¥25,631,057
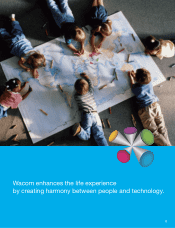
Our corporate vision is “creating harmony between people and technology.” How do we do this? By providing
technologically-sophisticated tools that are natural to use and people-friendly. Anyone can use them.
In the 1980s we pioneered the development of cordless and battery-free pen tablets – a brand new way of working
that opened up fresh, creative possibilities. Graphic artists around the world immediately prized the pen tablet’s
user-friendly interface and versatility. To this day, the pen tablet is an absolute must-have in the world of graphics.
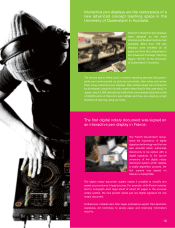
We did not stop there. We thought, “What if you could draw directly on to a computer screen?” Our interactive pen
displays enable users to do just that. These products are now hugely popular in many business sectors, including
medical firms, educational institutions, transportation/shipping companies and those enterprises that need more
natural and interactive ways to use computers.
We then looked at how we could make life better for mobile users such as traveling executives, doctors and truck
drivers. We incorporated pen-sensor components into Tablet PCs so that handwritten notes can be added more
easily to documents during meetings and interviews. This makes data entry faster and more natural and efficient
than ever before.
Our pen tablets continue to be adopted into new application areas, and we are committed to the ongoing develop-
ment of exciting new technologies. Our aim is to revolutionize both the workplace and the home with our user-
interface technology. We’re looking forward to seeing where this takes us. It’s going to be an exciting journey.
Forward-looking statements regarding future events and performance contained in this annual report are based on currently available information and involve risks
and uncertainties, including macroeconomic conditions, trends of the industry in which the company is engaged, and progress in technologies. Please note that
actual results could materially differ from those expressed or implied by the forward-looking statements in this annual report due to these risks and uncertainties.