Vtech 2011 Annual Report Download - page 9
Download and view the complete annual report
Please find page 9 of the 2011 Vtech annual report below. You can navigate through the pages in the report by either clicking on the pages listed below, or by using the keyword search tool below to find specific information within the annual report.-
 1
1 -
 2
2 -
 3
3 -
 4
4 -
 5
5 -
 6
6 -
 7
7 -
 8
8 -
 9
9 -
 10
10 -
 11
11 -
 12
12 -
 13
13 -
 14
14 -
 15
15 -
 16
16 -
 17
17 -
 18
18 -
 19
19 -
 20
20 -
21
-
22
-
23
-
24
-
25
-
26
-
27
-
28
-
29
-
30
-
31
-
32
-
33
-
34
-
35
-
36
-
37
-
38
-
39
-
40
-
41
-
42
-
43
-
44
-
45
-
46
-
47
-
48
-
49
-
50
-
51
-
52
-
53
-
54
-
55
-
56
-
57
-
58
-
59
-
60
-
61
-
62
-
63
-
64
-
65
-
66
-
67
-
68
 |
 |

VTech Holdings Ltd Annual Report 2011 7
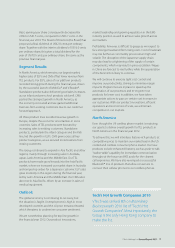
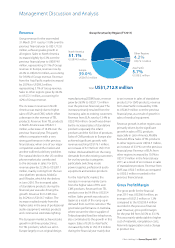
North America
51.1%
US$874.9 million
Europe
39.0%
US$667.6 million
Other Regions
4.2%
US$72.1 million
Asia Pacific
5.7%
US$98.2 million
Group Revenue by Region (FY2011)
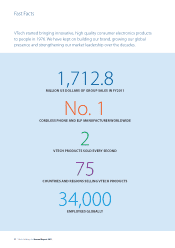
Total: US$1,712.8 million
Management Discussion and Analysis
Revenue
Group revenue for the year ended
31 March 2011 rose by 11.8% over the
previous financial year to US$1,712.8
million, achieving sales growth in
all regions. Sales to North America
increased slightly by 0.3% over the
previous financial year to US$874.9
million, representing 51.1% of Group
revenue. In Europe, revenue rose by
26.2% to US$667.6 million, accounting
for 39.0% of Group revenue. Revenue
from the Asia Pacific market increased
by 20.5% to US$98.2 million,
representing 5.7% of Group revenue.
Sales to other regions grew by 46.2%
to US$72.1 million, accounting for
4.2% of Group revenue.
The increase in revenue in North
America was mainly due to higher
sales of ELPs and CMS, which offset
a decrease in the revenue of TEL
products. Revenue from TEL products
in North America was US$421.1
million, a decrease of 18.3% over the
previous financial year. This partly
reflects comparison with a very
strong performance in the previous
financial year, when one of our major
competitors exited the market and
another suffered a delivery problem.
The natural decline in the US cordless
phone market also contributed
to the decrease in sales. For ELPs,
revenue grew by 22.2% to US$287.1
million, mainly coming from the two
new platform products, MobiGo
and V.Reader, which hit the shelves
in June 2010. The increased sales
of standalone products during the
financial year was also driving the
growth. Revenue from CMS rose
by 36.2% to US$166.7 million. The
increase resulted mainly from the
higher sales in the area of professional
audio equipment, wireless products
and commercial solid state lighting.
The European market achieved sales
growth in all three product lines.
For TEL products, which we sell in
Europe largely on an original design
manufacturing (ODM) basis, revenue
grew by 26.9% to US$217.5 million
over the previous financial year. The
increase primarily resulted from the
increasing sales to existing customers.
Revenue from ELPs rose by 13.4% to
US$274.0 million. Growth was driven
by the increased sales of standalone
products especially the infant
products and the Kidi line of products.
Sales of CMS products to Europe also
achieved significant growth, with
revenue reaching US$176.1 million,
an increase of 52.1% from US$115.8
million. We benefited from the rising
demands from the existing customers
for our key product categories
particularly switching mode
power supplies, professional audio
equipment and wireless products.
For the Asia Pacific market, the
increase in revenue mainly came
from the higher sales of TEL and
CMS products. Revenue from TEL
products rose by 54.6% to US$35.4
million. Sales growth was robust in
Japan as a result of the ramp up in
demand from our first customer. The
good sales performance in Australia,
where we are the direct supplier of
Telstra-branded fixed line telephones,
also contributed to the growth in this
region. Sales of ELPs to Asia Pacific
increased by 0.6% to US$15.9 million
during the financial year mainly due
to an increase in sales of standalone
products. For CMS products, revenue
from Asia Pacific increased by 9.6%
to US$46.9 million over the previous
financial year, as a result of growth in
sales of medical equipment.
Revenue growth in other regions was
primarily driven by the significant
growth in sales of TEL products
especially in Latin America, Middle
East and Africa. Sales of TEL products
to other regions were US$53.5 million,
an increase of 63.1% over the previous
financial year. Revenue of ELPs from
other regions increased by 10.5% to
US$17.9 million in the financial year
2011, as a result of an increase in sales
of standalone products. Revenue from
CMS was US$0.7 million as compared
to US$0.3 million recorded in the
previous financial year.
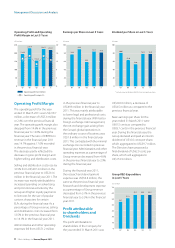
Gross Profit/Margin
The gross profit for the financial
year 2011 was US$566.9 million, an
increase of US$7.5 million or 1.3%
compared to the US$559.4 million
recorded in the previous financial
year. However, gross profit margin
for the year fell from 36.5% to 33.1%.
This was mainly attributable to higher
cost of materials, rising labour costs,
Renminbi appreciation and a change
in product mix.