Vonage 2013 Annual Report Download - page 91
Download and view the complete annual report
Please find page 91 of the 2013 Vonage annual report below. You can navigate through the pages in the report by either clicking on the pages listed below, or by using the keyword search tool below to find specific information within the annual report.-
 1
1 -
2
-
3
-
4
-
5
-
6
-
7
-
8
-
9
-
10
-
11
-
12
-
13
-
14
-
15
-
16
-
17
-
18
-
19
-
20
-
21
-
22
-
23
-
24
-
25
-
26
-
27
-
28
-
29
-
30
-
31
-
32
-
33
-
34
-
35
-
36
-
37
-
38
-
39
-
40
-
41
-
42
-
43
-
44
-
45
-
46
-
47
-
48
-
49
-
50
-
51
-
52
-
53
-
54
-
55
-
56
-
57
-
58
-
59
-
60
-
61
-
62
-
63
-
64
-
65
-
66
-
67
-
68
-
69
-
70
-
71
-
72
-
73
-
74
-
75
-
76
-
77
-
78
-
79
-
80
-
 81
81 -
 82
82 -
 83
83 -
 84
84 -
 85
85 -
 86
86 -
 87
87 -
 88
88 -
 89
89 -
 90
90 -
 91
91 -
 92
92 -
 93
93 -
 94
94 -
 95
95 -
 96
96 -
 97
97 -
 98
98
 |
 |

F-35 VONAGE ANNUAL REPORT 2013
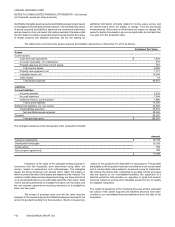
Note 13. Geographic Information
Our chief operating decision-makers review financial
information presented on a consolidated basis, accompanied by
disaggregated information about revenues and marketing expenses for
purposes of allocating resources and evaluating financial performance.
Accordingly, we consider ourselves to be in a single reporting segment
and operating unit structure.
Information about our operations by geographic location is as follows:
For the years ended December 31,
2013 2012 2011
Revenue:
United States $ 784,665 $ 804,870 $825,928
Canada 32,348 32,570 32,135
United Kingdom 12,054 11,674 12,260
$ 829,067 $ 849,114 $870,323
December 31,
2013
December 31,
2012
Long-lived assets:
United States $ 231,335 $ 85,331
Brazil 845 —
United Kingdom 821 1,032
Israel 276 411
$ 233,277 $ 86,774
Note 14. Quarterly Financial Information (Unaudited)
The following table sets forth the reviewed consolidated quarterly financial information for 2013 and 2012:
For the Quarter Ended
March 31, June 30, September 30, December 31, Total
Year Ended 2013
Revenue $ 209,087 $ 204,776 $ 203,984 $ 211,220 $ 829,067
Net income attributable to Vonage 13,047 7,447 4,207 3,588 28,289
Net income attributable to Vonage per common share:
Basic 0.06 0.04 0.02 0.02
Diluted 0.06 0.03 0.02 0.02
Year Ended 2012
Revenue $ 215,903 $ 211,916 $ 207,584 $ 213,711 $ 849,114
Net income (loss) 13,921 (3,340) (1) 13,213 12,833 36,627
Net income (loss) per common share:
Basic 0.06 (0.01)0.06 0.06
Diluted 0.06 (0.01)0.06 0.06
(1) In the second quarter of 2012, we wrote-off of our investment in the Amdocs system, net of settlement amounts to the Company of
$25,262.
Table of Contents
VONAGE HOLDINGS CORP.
NOTES TO CONSOLIDATED FINANCIAL STATEMENTS—(Continued)
(In thousands, except per share amounts)