Vectren 2013 Annual Report Download - page 12
Download and view the complete annual report
Please find page 12 of the 2013 Vectren annual report below. You can navigate through the pages in the report by either clicking on the pages listed below, or by using the keyword search tool below to find specific information within the annual report.-
 1
1 -
 2
2 -
 3
3 -
 4
4 -
 5
5 -
 6
6 -
 7
7 -
 8
8 -
 9
9 -
 10
10 -
 11
11 -
 12
12 -
 13
13 -
 14
14 -
 15
15 -
 16
16 -
 17
17 -
 18
18 -
 19
19 -
 20
20 -
 21
21 -
 22
22 -
23
-
24
-
25
-
26
-
27
-
28
-
29
-
30
-
31
-
32
-
33
-
34
-
35
-
36
-
37
-
38
-
39
-
40
-
41
-
42
-
43
-
44
-
45
-
46
-
47
-
48
-
49
-
50
-
51
-
52
-
53
-
54
-
55
-
56
-
57
-
58
-
59
-
60
-
61
-
62
-
63
-
64
-
65
-
66
-
67
-
68
-
69
-
70
-
71
-
72
-
73
-
74
-
75
-
76
-
77
-
78
-
79
-
80
-
81
-
82
-
83
-
84
-
85
-
86
-
87
-
88
-
89
-
90
-
91
-
92
-
93
-
94
-
95
-
96
-
97
-
98
-
99
-
100
-
101
-
102
-
103
-
104
-
105
-
106
-
107
-
108
-
109
-
110
-
111
-
112
-
113
-
114
-
115
-
116
-
117
-
118
-
119
-
120
-
121
-
122
-
123
-
124
-
125
-
126
-
127
-
128
-
129
-
130
-
131
-
132
-
133
-
134
-
135
-
136
-
137
-
138
-
139
-
140
 |
 |

10
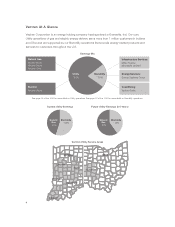
Utility Group
The Utility Group consists of the Company’s regulated operations and other operations that provide information technology and
other support services to those regulated operations. The Company segregates its regulated operations into a Gas Utility
Services operating segment and an Electric Utility Services operating segment. The Gas Utility Services segment includes the
operations of Indiana Gas, VEDO, and SIGECO’s natural gas distribution business and provides natural gas distribution and
transportation services to nearly two-thirds of Indiana and to west central Ohio. The Electric Utility Services segment includes
the operations of SIGECO’s electric transmission and distribution services, which provides electric transmission and distribution
services to southwestern Indiana, and includes its power generating and wholesale power operations. In total, these regulated
operations supply natural gas and/or electricity to over one million customers. Following is a more detailed description of the
Utility Group’s Gas Utility and Electric Utility operating segments.
Gas Utility Services
At December 31, 2013, the Company supplied natural gas service to approximately 1,005,900 Indiana and Ohio customers,
including 919,000 residential, 85,200 commercial, and 1,700 industrial and other contract customers. Average gas utility
customers served were approximately 992,100 in 2013, 986,100 in 2012, and 983,700 in 2011.
The Company’s service area contains diversified manufacturing and agriculture-related enterprises. The principal industries
served include automotive assembly, parts and accessories; feed, flour and grain processing; metal castings, aluminum
products, polycarbonate resin (Lexan®) and plastic products; gypsum products; electrical equipment, metal specialties, glass
and steel finishing; pharmaceutical and nutritional products; gasoline and oil products; ethanol; and coal mining. The largest
Indiana communities served are Evansville, Bloomington, Terre Haute, suburban areas surrounding Indianapolis and Indiana
counties near Louisville, Kentucky. The largest community served outside of Indiana is Dayton, Ohio.
Revenues
The Company receives gas revenues by selling gas directly to customers at approved rates or by transporting gas through its
pipelines at approved rates to customers that have purchased gas directly from other producers, brokers, or marketers. Total
throughput was 223.6 MMDth for the year ended December 31, 2013. Gas sold and transported to residential and commercial
customers was 111.9 MMDth representing 50 percent of throughput. Gas transported or sold to industrial and other contract
customers was 111.7 MMDth representing 50 percent of throughput. Rates for transporting gas generally provide for the same
margins earned by selling gas under applicable sales tariffs. In 2012, natural gas began being transported to a natural gas fired
power plant that was recently placed into service in the Vectren South service territory. Volumes were 6.6 MMDth in 2013, and
6.3 MMDth in 2012. Revenues associated with gas volumes delivered to the new plant are based on a monthly fixed charge.
For the year ended December 31, 2013, gas utility revenues were approximately $810.0 million, of which residential customers
accounted for 67 percent and commercial accounted for 24 percent. Industrial and other contract customers accounted for only
9 percent of revenues.
Availability of Natural Gas
The volumes of gas sold is seasonal and affected by variations in weather conditions. To meet seasonal demand, the
Company’s Indiana gas utilities have storage capacity at eight active underground gas storage fields and three propane
plants. Periodically, purchased natural gas is injected into storage. The injected gas is then available to supplement contracted
and manufactured volumes during periods of peak requirements. The volumes of gas per day that can be delivered during peak
demand periods for each utility are located in “Item 2 Properties.”
Natural Gas Purchasing Activity in Indiana
The Indiana utilities also enter into short term and long term contracts with third party suppliers to ensure availability of gas.
Prior to June 18, 2013, the Company contracted with a wholly-owned subsidiary of ProLiance Holdings, LLC
(ProLiance). ProLiance is an unconsolidated, nonutility, energy marketing affiliate of Vectren and Citizens Energy Group
(Citizens). On June 18, 2013, ProLiance exited the natural gas marketing business through the disposition of certain of the net