Union Pacific 2009 Annual Report Download - page 7
Download and view the complete annual report
Please find page 7 of the 2009 Union Pacific annual report below. You can navigate through the pages in the report by either clicking on the pages listed below, or by using the keyword search tool below to find specific information within the annual report.-
 1
1 -
 2
2 -
 3
3 -
 4
4 -
 5
5 -
 6
6 -
 7
7 -
 8
8 -
 9
9 -
 10
10 -
 11
11 -
 12
12 -
 13
13 -
 14
14 -
 15
15 -
 16
16 -
 17
17 -
 18
18 -
19
-
20
-
21
-
22
-
23
-
24
-
25
-
26
-
27
-
28
-
29
-
30
-
31
-
32
-
33
-
34
-
35
-
36
-
37
-
38
-
39
-
40
-
41
-
42
-
43
-
44
-
45
-
46
-
47
-
48
-
49
-
50
-
51
-
52
-
53
-
54
-
55
-
56
-
57
-
58
-
59
-
60
-
61
-
62
-
63
-
64
-
65
-
66
-
67
-
68
-
69
-
70
-
71
-
72
-
73
-
74
-
75
-
76
-
77
-
78
-
79
-
80
-
81
-
82
-
83
-
84
-
85
-
86
-
87
-
88
-
89
-
90
-
91
-
92
-
93
-
94
-
95
-
96
-
97
-
98
-
99
-
100
-
101
-
102
-
103
-
104
-
105
-
106
-
107
-
108
-
109
-
110
-
111
-
112
-
113
-
114
 |
 |
7
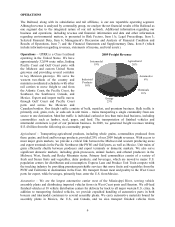
manufacturing facilities in Canada and Mexico. In 2009, transportation of finished vehicles and
automotive materials accounted for 6% of our freight revenues.
Chemicals – Transporting chemicals provided 16% of our freight revenues in 2009. Our franchise enables
us to serve the chemical producing areas along the Gulf Coast, as well as the Rocky Mountain region.
Two-thirds of the chemicals business consists of industrial chemicals, plastics, and liquid petroleum
products. In addition to transporting plastics, customers also use our storage-in-transit yards for
intermediate storage of plastic resins. Soda ash shipments originate in southwestern Wyoming and
California destined primarily for glass producing markets in the East, the West, and abroad. Fertilizer
movements originate primarily in the Gulf Coast region, as well as the West and Canada, bound for major
agricultural users in the Midwest and the western U.S.
Energy – Coal transportation accounted for 23% of our 2009 freight revenues. Our transportation network
allows us to transport coal and coke to utilities, industrial facilities, interchange points, and water
terminals. The water terminals provide access to the West and Gulf Coasts for export, and rail/barge
interchange facilities on the Mississippi and Ohio Rivers and the Great Lakes. We serve mines located in
the Southern Powder River Basin of Wyoming (SPRB), Colorado, Utah, southern Wyoming, and
southern Illinois. SPRB coal represents the largest growth segment of the market, as utilities continue to
favor its lower cost and low-sulfur content.
Industrial Products – Our extensive network enables us to move numerous commodities between
thousands of origin and destination points throughout North America. Lumber shipments originate
primarily in the PNW and Canada for destinations throughout the United States for new home
construction and repair and remodeling. Commercial and highway construction drives shipments of steel
and construction products, consisting of rock, cement, and roofing materials. Paper and consumer goods,
including furniture and appliances, are shipped to major metropolitan areas for consumers. Nonferrous
metals and industrial minerals are moved for industrial manufacturing. In addition, we provide efficient
and safe transportation for government entities and waste companies. In 2009, transporting industrial
products provided 16% of our freight revenues.
Intermodal – Our intermodal business, which represented 19% of our freight revenues in 2009, includes
international and domestic shipments. International business consists of imported or exported container
traffic that arrives at, or departs from, West Coast ports via ocean vessel. Domestic business includes
domestic container and trailer traffic for major retailers and other U.S. businesses that is sold through
intermodal marketing companies (primarily shipper agents and consolidators) and truckload carriers.
Seasonality – Some of the commodities we carry have peak shipping seasons, reflecting either or both the
nature of the commodity, such as certain agricultural and food products that have specific growing and
harvesting seasons, and the demand cycle for the commodity, such as intermodal traffic, which generally
has a peak shipping season during the third quarter to meet holiday-related demand for consumer goods
during the fourth quarter. The peak shipping seasons for these commodities can vary considerably from
year to year depending upon various factors, including the strength of domestic and international
economies and currencies and the strength of harvests and market prices of agricultural products. In
response to an annual request delivered by the Surface Transportation Board (STB) of the United States
Department of Transportation (DOT) to all of the Class I railroads operating in the U.S., we issue a letter
during the third quarter detailing our plans for handling traffic during the third and fourth quarters and
providing other information requested by the STB.
Working Capital – At December 31, 2009, we had a working capital surplus, which reflects our decision
to maintain additional cash reserves to enhance liquidity in response to difficult economic conditions. At
December 31, 2008, we had a working capital deficit. Historically, we have had a working capital deficit,
which is common in our industry and does not indicate a lack of liquidity. We maintain adequate