Union Pacific 2009 Annual Report Download - page 16
Download and view the complete annual report
Please find page 16 of the 2009 Union Pacific annual report below. You can navigate through the pages in the report by either clicking on the pages listed below, or by using the keyword search tool below to find specific information within the annual report.-
 1
1 -
2
-
3
-
4
-
5
-
 6
6 -
 7
7 -
 8
8 -
 9
9 -
 10
10 -
 11
11 -
 12
12 -
 13
13 -
 14
14 -
 15
15 -
 16
16 -
 17
17 -
 18
18 -
 19
19 -
 20
20 -
 21
21 -
 22
22 -
 23
23 -
 24
24 -
 25
25 -
 26
26 -
27
-
28
-
29
-
30
-
31
-
32
-
33
-
34
-
35
-
36
-
37
-
38
-
39
-
40
-
41
-
42
-
43
-
44
-
45
-
46
-
47
-
48
-
49
-
50
-
51
-
52
-
53
-
54
-
55
-
56
-
57
-
58
-
59
-
60
-
61
-
62
-
63
-
64
-
65
-
66
-
67
-
68
-
69
-
70
-
71
-
72
-
73
-
74
-
75
-
76
-
77
-
78
-
79
-
80
-
81
-
82
-
83
-
84
-
85
-
86
-
87
-
88
-
89
-
90
-
91
-
92
-
93
-
94
-
95
-
96
-
97
-
98
-
99
-
100
-
101
-
102
-
103
-
104
-
105
-
106
-
107
-
108
-
109
-
110
-
111
-
112
-
113
-
114
 |
 |

16
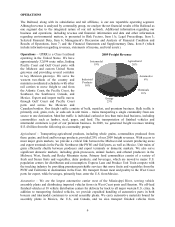
Annual Lifts
Top 10 Intermodal Terminals 2009 2008
ICTF (Los Angeles), California 453,000 619,000
East Los Angeles, California 372,000 383,000
Global I (Chicago), Illinois 306,000 291,000
Global II (Chicago), Illinois 284,000 299,000
Marion (Memphis), Tennessee 265,000 360,000
City of Industry (Los Angeles), California 254,000 206,000
Lathrop (Stockton), California 250,000 198,000
Dallas, Texas 233,000 294,000
Oakland, California 202,000 222,000
Yard Center (Chica go), Illinois 199,000 227,000
Rail Equipment – Our equipment includes owned and leased locomotives and rail cars; heavy
maintenance equipment and machinery; other equipment and tools in our shops, offices, and facilities;
and vehicles for maintenance, transportation of crews, and other activities. As of December 31, 2009, we
owned or leased the following units of equipment:
Average
Age (yrs.) Locomotives Owned Leased Total
Road 5,076 2,659 7,735 15.1
Switching 437 26 463 30.6
Other 97 55 152 22.4
Total locomotives 5,610 2,740 8,350 N/A
Average
Age (yrs.) Freight cars Owned Leased Total
Covered hoppers 12,764 20,024 32,788 30.1
Open hoppers 12,615 4,936 17,551 30.2
Gondolas 6,730 6,374 13,104 27.3
Boxcars 5,891 2,312 8,203 27.1
Refrigerated cars 2,630 4,484 7,114 21.6
Flat cars 3,101 734 3,835 32.0
Other 104 498 602 N/A
Total freight cars 43,835 39,362 83,197 N/A
Capital Expenditures – Our rail network requires significant annual capital investments for replacement,
improvement, and expansion. These investments enhance safety, support the transportation needs of our
customers, and improve our operational efficiency. Additionally, we add new locomotives and freight
cars to our fleet to replace older, less efficient equipment, to support growth and customer demand, and to
reduce our impact on the environment through the acquisition of more fuel efficient and low-emission
locomotives.
2009 Capital Expenditures – During 2009, we made capital investments totaling $2.5 billion, which
included cash spending of $2.4 billion (see the capital expenditures table in Management’ s Discussion