Union Pacific 2005 Annual Report Download - page 4
Download and view the complete annual report
Please find page 4 of the 2005 Union Pacific annual report below. You can navigate through the pages in the report by either clicking on the pages listed below, or by using the keyword search tool below to find specific information within the annual report.-
 1
1 -
 2
2 -
 3
3 -
 4
4 -
 5
5 -
 6
6 -
 7
7 -
 8
8 -
 9
9 -
 10
10 -
 11
11 -
 12
12 -
 13
13 -
 14
14 -
 15
15 -
16
-
17
-
18
-
19
-
20
-
21
-
22
-
23
-
24
-
25
-
26
-
27
-
28
-
29
-
30
-
31
-
32
-
33
-
34
-
35
-
36
-
37
-
38
-
39
-
40
-
41
-
42
-
43
-
44
-
45
-
46
-
47
-
48
-
49
-
50
-
51
-
52
-
53
-
54
-
55
-
56
-
57
-
58
-
59
-
60
-
61
-
62
-
63
-
64
-
65
-
66
-
67
-
68
-
69
-
70
-
71
-
72
-
73
-
74
-
75
-
76
-
77
-
78
-
79
-
80
-
81
-
82
-
83
-
84
-
85
-
86
-
87
-
88
-
89
-
90
-
91
-
92
-
93
-
94
-
95
-
96
-
97
-
98
-
99
-
100
 |
 |
SAFETY FIRST
Union Pacic’s approach to safety is one of zero tolerance.
Although the rail industry is already one of the safest in
America, we are working daily to improve. In 2005, our
number of derailments improved 8 percent and the
associated costs decreased 12 percent. We also enhanced
grade crossing safety through the closure of 400 rail
crossings and the installation of 750 locomotive video
cameras. Cameras provide valuable evidence for accident
investigations
. In 2006, we will continue our focus on
employee safety education and training, public awareness
and derailment prevention.
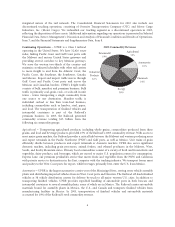
OPERATING INITIATIVES
Strong business demand and signicant attrition in our
aging workforce required additional resources to meet the
needs of our customers. Last year, we continued eorts
begun in 2004 to bolster the Railroad’s critical assets -
employees, locomotives and freight cars. We hired and
trained nearly 2,100 conductors and 1,700 engineers and
added 317 new fuel-ecient, emissions-compliant
locomotives and 4,200 freight cars. We also increased our
network capacity through targeted capital spending in
some of our fastest growing corridors. Our Intermodal
capacity increased with the opening of new facilities in
Dallas and Salt Lake City, we installed 69 miles of double
track on our Sunset Corridor and 14 miles of triple track
to the SPRB Joint Line.
We began implementing our Unied Plan in April,
instituting changes to our transportation plan. e Unied
Plan is one of several network initiatives started in 2005 to
redesign and simplify our operations. e goal is to increase
velocity and improve customer service by reducing the
workload on the network. Two areas targeted by the Unied
Plan are main line train stops and terminal switching.
At the beginning of the year, only a third of UP’s regularly
scheduled trains moved from origin to destination without
stopping. e average manifest car was switched three
times before arriving at its destination. rough the Unied
Plan, our rate of train stops declined 16 percent and our car
switching rate decreased 12 percent. is work links directly
to improved terminal dwell time and reduced rail car
inventory we experienced in 2005. We have more hard work
ahead of us to increase eciency, but customers are starting
to recognize our eorts and are working with us to make
operational changes.
We are also improving terminal eciency through a newly
developed technology tool called our Customer Inventory
Management System (CIMS). We use CIMS to proactively
manage terminal inventory and increase asset utilization
as well as help customers improve processing eciency.
e overall goal is to generate more terminal throughput
with existing capacity. e initial CIMS pilot location was
Phoenix. We subsequently rolled it out to major terminals in
Las Vegas, Los Angeles, San Antonio and Houston, covering
40 percent of daily industry switching. In 2006, we plan to
implement CIMS in additional terminals, including Salt
Lake City, Roseville, Portland, Seattle, Fort Worth, Kansas
City and Little Rock.
Velocity was relatively unchanged versus 2004, largely due
to the many weather issues we faced. Increasing network
velocity is a key objective for 2006, and a continued emphasis
on Unied Plan compliance is vital to achieving that goal.
In conjunction with the Unied Plan, we are increasing
capacity by employing industrial engineering strategies that
require little or no capital investment. For example, we
initiated projects to:
• improve system velocity by reducing terminal dwell time,
• increase locomotive availability by decreasing locomotive
service time,
• conserve fuel by reducing locomotive fuel consumption
through technology and training, and
• facilitate volume growth by de-bottlenecking constrained
terminals, intermodal yards and key rail corridors.
Additionally, teams in Phoenix, Houston, Kansas City and
Los Angeles have studied trac ows, operating practices
and processes to increase throughput in these capacity-
constrained areas.
ANOTHER YEAR OF RECORD FUEL PRICES
Following a more than 40 percent increase in diesel fuel
prices in 2004, we experienced another huge increase in
2005. Our average diesel fuel price in the rst quarter was
$1.45 per gallon, but it increased to $2.08 per gallon by the
fourth quarter. Two factors drove the increase: crude oil
prices and rening spreads. Aer starting the year at about
$40 per barrel, the price of crude oil topped out over $70 per
barrel in September. In addition, rening spreads nearly
tripled following the fall hurricanes.
Although somewhat mitigated by our fuel surcharge
programs, rising fuel prices decreased our 2005 operating
income. Our goal is 100 percent recovery of higher fuel
costs to eliminate the earnings impact. Longer-term,
high fuel prices create a competitive advantage for us, as
rail transportation is three times more fuel ecient than
trucking. We also increased our emphasis on fuel
conservation through engineer training and improved
locomotive technology. In 2005, our consumption rate
improved by 2 percent, saving 35 million gallons of fuel.
2